The Consequences of Broken Long Term Trendlines
As if investors didn’t have enough to worry about for the holidays here is one more concern.
In general it is our practice to respond to events in the market, rather than trying to anticipate them. This may be looked at as letting the market dictate what should be done, rather than dictating to the market (a notoriously stubborn and unreliable conversationalist).
But. (But means everything that went before is now negated.) But, recently Robert Prechter issued a dictum to the market (or at least to investors): He has mandated that his followers go 200% short the market. This is because Elliott Wave practitioners, following their model, believe that the present bull market (or bear market rally) is effectively dead and that a severe downwave will now ensue. Of course it is worth remembering that the Elliott Wave model predicted a market top of approximately 6500 in the run up of the 80s and’90s.
The mathematician George Box aptly remarked: All models are wrong, and some are useful.
Technical analysis as defined by Edwards and Magee, and primarily practiced by Magee, does not present a model of the market in the larger sense. Rather, it observes the market over time and notes that patterns tend to repeat in market issues. Based on these repetitions it takes positions which it regards as experiments. Each experiment is closely monitored, and terminated if it does not progress as expected. Each is followed and increased if it progresses. When the experiment stops working the commitment is liquidated.
In words of one syllable (except for this one): Identify the conditions which indicate a trend is starting or is in progress; buy it; as if progresses increase commitment; as it progresses raise the trailing stop to lock in profits; when the stop is violated abandon the issue.
This is in contradistinction to Elliott Wave Theory, which avers that the model dictates an investment posture now which is against the present trend, e.g., selling an uptrend.
Of Magee’s methods the most prominent and well known is the trendline. I will not waste words describing the trendline. Only the newest of beginners doesn’t know what a trendline is. (A tribute to the power of Edwrds and Magee’s classic book, Technical Analysis of Stock Trends (9th ed).
It is a simple and obvious truism (but an ignored one) that no bull market ends without the breaking of its long term trendlines. I say ignored, because if it were observed and honored why did most of market participants lose upwards of 40% in the Bush bear market?
Interestingly, at this moment in time, there is a trendline analysis which lends some light to the Elliott Wave position. Here are two charts which present an investment conundrum.
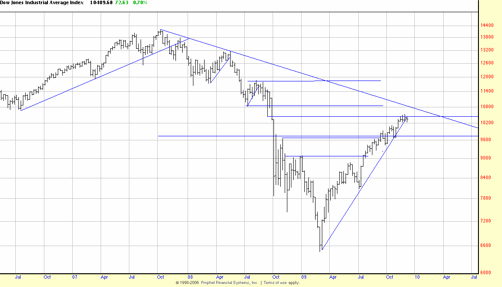
Here in the first chart we see the last two years, more or less. Price at this moment is breaking the trendline from March, and is nose up against a resistance line. At the left the trendline break which preceded the bear market of 2008-09.

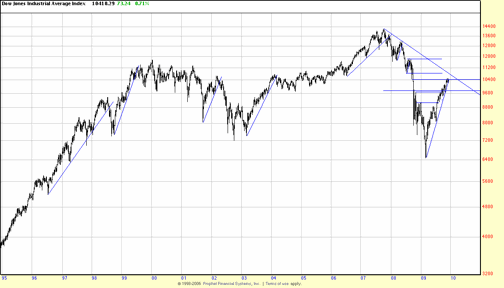
Below is a long term chart which illustrates what happens when these long term trendlines are broken. What happens is never good. A long term trendline break is invariable followed by, at best, a sidewave, and at worst, a downwave which can vary in intensity. Given the immediate past, and immediate present state of the economy a downwave at this point might be most unpleasant.
There are three ways to deal with this general market condition: 1. begin hedging, 2. wait until the nearest Basing Points and stops are violated, and then hedge or sell, 3. Set stops based on the highs rather than the last Basing Point. A fourth alternative is one we have recommended constantly – the natural hedge, or a balance of short positions in the portfolio. At any rate this situation makes it imperative for investors to be prepared to deal with a trend change and not to sit on their positions.


