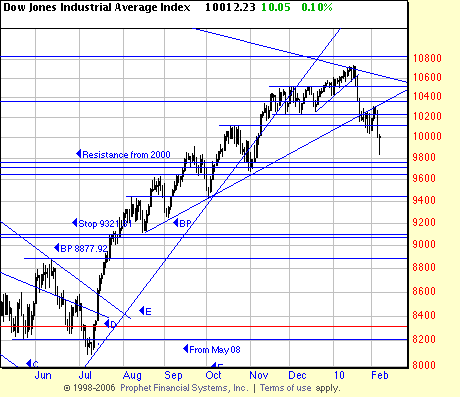
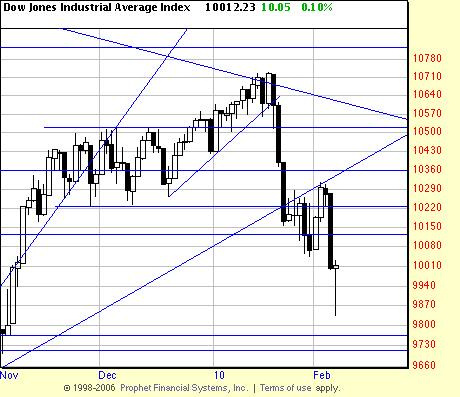
 We are curious about everything (like Curious George) and skeptical about everything including skepticism. So we are of course aware of candlestick patterns and watch them with some interest. But we do not depend on their interpretation. Finally that comes down to our reading of the good old fashioned chart. We do show a lot of charts in candlestick notation because we think the black and white candles give emphasis to prevailing momentum.
Today’s candlestick is called, variously, a “hammer” and/or a “hanging man” depending on where it appears in the trend. In a downtrend it is a hammer (as, the market is hammering out a base) and is a bullish pattern. This makes sense, as the day’s action can also be interpreted as a one day reversal. Market opens reasonably, plunges looking for support, finds buying and closes over opening.

It may in fact be a reversal day but it is a little puzzling to us. Volume was nothing eye-catching. We didn’t cover our hedges when the market came off the bottom today. The entire formation is somewhat unorthodox. (Not liberal or reform, just unorthodox.) The flag is aesthetically unattractive, if a flag. And if it is a flagpole today’s pole has an awfully skinny leg. We will be watching and waiting. We are essentially mostly hedged on indices and metals and are looking for a signal to close the hedges and get long again — or for a signal to get net short.
It has been an interesting, if weird, week and we will be posting other comments over the next few days.

