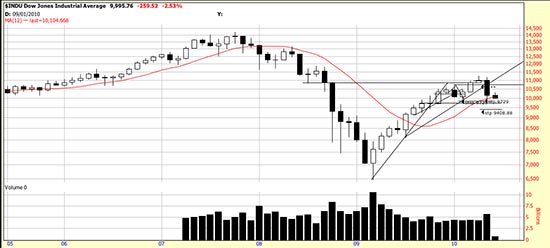
 Readers who have read Sacred Chickens, the Holy Grail and Dow Theory will remember that the system discussed there used weekly bars. Weekly bars have the characteristic of stepping back from daily volatility and enabling the tracking of long term trends with more tranquility. We took a look at this system given the extreme volatility of the last 30 trading days. In this system the Basing Point is more clearly articulated than in the daily system, occurring at the downwave low of February. We have annotated the chart with the stop generated from this Basing Point, and as the reader will see it is around 300 points lower than the daily stop. This might appear to be just theoretical nattering, but if we were sitting on large long term positions we would be using this stop. And we would be trading against it to ameliorate the short term pain of the downwave.
In actuality we consider this a better trend reversal stop than the higher stop, but we will use the higher stop for ourselves if it is hit. Readers must make this decision for themselves. Our analysis of the market at this time does not lead us to expect a long term trend change. We think this downwave is technical in nature, using Greece and BP as excuses. Its purpose is to dislodge general investors who have had the temerity to reenter the market after the 2009 low. Once they are shaken out the market can proceed to a new bull market leg.
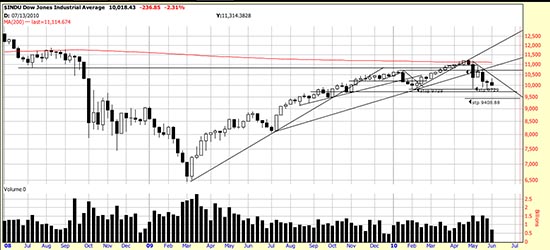
In one of those instances of serendipity the long term trendline ran smack through the new high stop (the asterisks). We were hedging around this level, as traders should have been. But naturally we were tossed around by the volatilty and only have on a partial hedge in the Dow while our major position in the Qs is unhedged. We considered hedging it Friday, but we didn’t have a flash computer and considered that we would just be whipped, as we suspect Monday will be an up day.
 Of technical interest the market is sitting on the 12 month moving average. It is also below the 200 day moving average, and that may or may not be important.
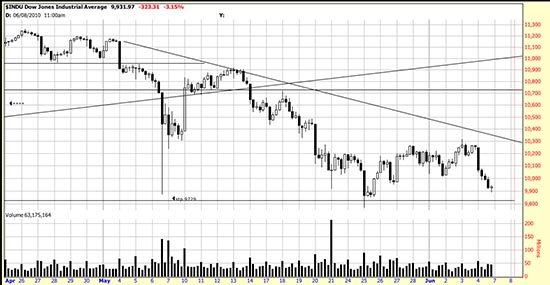
While Friday was a nasty day it did not change the nature of the hourly pattern.
 The hourly data still looks like a bottom — but as always a pattern of this sort can be either a reversal or a continuation. If the low is taken out here we may very well see more downside action. Readers should pay attention Monday when we will post a letter if the situation warrants it during the day.

