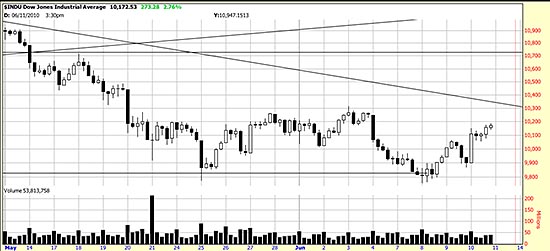
 Last Friday we analyzed an hourly chart of the Dow and remarked that it looked like a bottom forming. Previously we had seen a possible Kilroy (or H&S) bottom. Identifying formations as they form is an amusing pursuit but not always edifying and often mistaken.
Which brings to mind Magee’s admonition to wait for resolutions rather than jumping the gun. Today the market took a serious bite out of the backside of the bears — 273 Dow points. And the formation here is now looking like a double bottom with a neckline of about 10300.
The power bar here has various meanings — it could be the beginning of the turnaround. It could be more bungee days. One thing it does mean is that bulls will jump (off bridges with a bungee tied to their backsides) at discounted stocks. And they are not all convinced by any means that a bear market is beginning.
We have consistently said, through this sell off, that it was a predictable downwave, however painful. And it is interesting that the daily Basing Point stop of 9729 (though threatened) is still holding prices. But before we call this bear cub dead we would like to see power bars moving above 10300.

