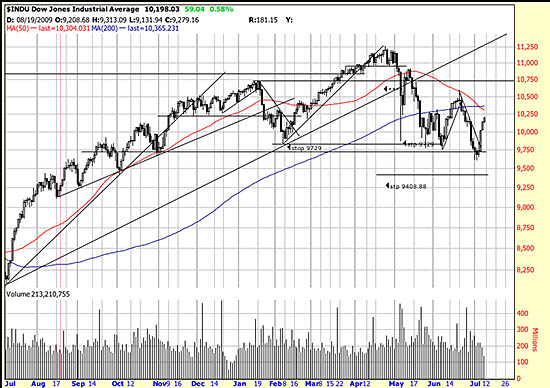
 Considering the number of short term trend changes we have seen lately, including the close below our stop investors could be excused for feeling double crossed. Then, on top of that the fabled and feared death cross has occurred. The “death cross” is illustrated above and occurs when the 50 day moving average crosses under the 200 day moving average. Many analysts interpret this as a death sign for the bull market.
We are not of the cook book school, rigidly interpreting technical indicators and signs the same in every situation. We analyze the entire context and the particularities of the issue in question. Here are the facts uncolored by the emotionality of a “death cross”.
We are presently in a 53 day downtrend, of which the last five days represent a wavelet up (or the beginning of an upwave). No wave in this trend has lasted longer than 10 days and there have been 8 changes of direction during this time. The violence and volatility of this downtrend are unprecedented. In fifty years of observing the markets this is the first time we have seen a 1000 point day. The flash crash may have been a technical glitch, but it set the stage for the rest of the move. In addition at the end of the downwave the market was down 7 days in a row. We don’t keep the statistics, but if we remember correctly this has only occurred three or four times in about 25 years. A very rare datum.
The wave pattem may have some useful information in it. It is not (and the reader can draw these lines for himself at stockcharts.com) a conventional downwave of lower highs and lower lows, although the lows are successively lower. Given the 7 days down and the violence of the sell off the present upwave (or wavelet) is to be expected. The immediate fate of the market rides on this wave. If it takes out the last high and moves higher the back of the downtrend will be broken. If it takes out the last low we foresee a real downtrend with serious consequences.
We have not marked one characteristic of this pattern because we wanted a cleaner chart to illustrate the death cross. The developing formation is a broadening pattern. Broadening patterns are most common at tops of waves, not bottoms. (We will post a chart later illustrating this.) But they are caused by fear panic and uncertainty.
That certainly describes the present atmosphere. In such conditions the prudent investor hedges and keeps his exposure low. And waits for clear signals as to the direction of the market.
The adroit trader (NOTE: Adroit) will be long today, and maybe short Monday. When wave (or wavelet) lengths are 9,6,9,7,4,10,10 and 5 you can see that you are either trading furiously — which we heartily do not recommend unless you are successful at it before you lose all your money, or you stand back, hedge and pick your targets. (We will sometime soon be writing a letter on dividend stocks.)
We do not sneer at the death cross — although we think that reaction to these events is market misinformation. In fact there is evidently a constituency for a double dip recession — and a bear camp rooting for a bear market. The fact that a Dow Theory sell signal has been generated is, like the death cross worth respect. One thing is for certain — any weak stocks you can find to short should be shorted. We will examine any short candidates you send us.


Any comments on the ‘head and shoulders’ top everyone and their dog has pointed out?
Not yet formed, but worrying about it is unnecessary at this point. We are in a secondary downtrend which could become a full fledged bear. What happens in the present wave is crucial. Don’t sweat the pattern identification — just analyze the wave.
cb