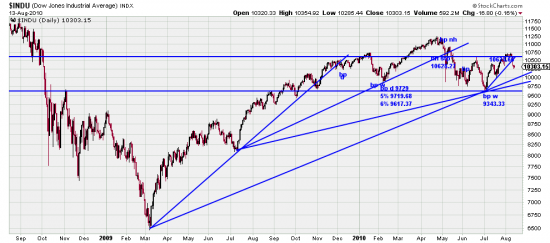
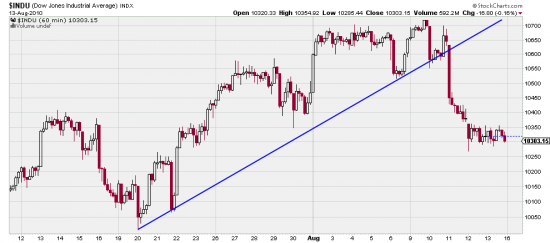
Here the crucial trendlines from the March 09 bottom. Any way you slice it the sloped trendlines are almost irrelevant at this point. The dominant and ominous line is the horizontal line across the wavelow made in July. The dominant line was that from July 09 — a 10 month line, whose breaking presaged the turbulence we are still experiencing. We really think that the market is day to day now and that extreme alertness is necessary. At the short term moment the breaking of the 26 day trendline is the focus. How the market reacts to this normal and expected downwave is now crucial. There is no trendline yet in this downwave. We have said that we thought it was possible to trade these short waves with hourly charts, but we would discourage it except for the most experienced readers — who have time to check the market frequently during the day. A pursuit we try to avoid ourselves. That way lies madness.
Even on the hourly chart the surge-drift-flush pattern shows.
A number of alert readers and students have commented at length that we might be forming the right shoulder of an eight month head and shoulders pattern. This is quite possible, but it is not necessary to hang your analysis on that pattern. Looked at on the two year chart that analysis looks very persuasive. Interestingly, if a head and shoulders, or just a pernicious downwave, everything converges on the daily and weekly stops we have shown under the July low here. If prices broke those stops we would think all hell to be in store. It would mean Basing Point stops broken, horizontal support line broken, sloped trendlines from March 09 broken, and neckline of head and shoulders broken.
If we can’t make some obscene profits off of the resulting downtrend we ought to quit trading and run for Congress.


