http://stockcharts.com/h-sc/ui?s=$SPX&p=D&yr=1&mn=0&dy=0&id=p62881197949&a=207879904
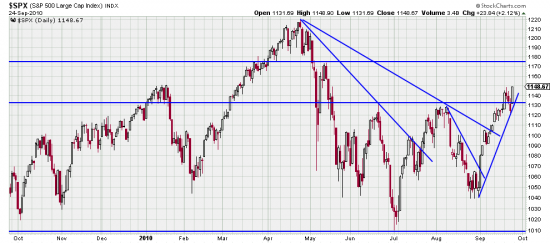
Two power bars in five days. One a breakout, and the other a confirmation. Rushing on to October we only had three down days after the breakout. What does this mean? Double dippers, chicken littles, bears throwing in their hands and getting out of the way.
This is a vivid lesson in not having opinions. It is also a vivid lesson in trying to take long term positions in a sideways market. Neither is a good idea.
Purely as a trade we bought the S&P Aug 27 as you will remember, and it has turned into a trend trade and we have added on.
The three day downwave (wavelet) has given us an anchor point for a fairly strong trend line. Nonetheless do not think that the skies are blue and there is clear sailing. We are still within the large trading range and the contrarians are not doing us any favors. They will be back selling this market at the first sign of weakness or cloudy skies — or a hiccup in the European bond market or word that there is a shortage of pumpkins for Halloween.
The entire market is in a buying mood right now. Euro, metals, precious metals (REE, hearing we had mentioned it, gapped up in a buy signal.)
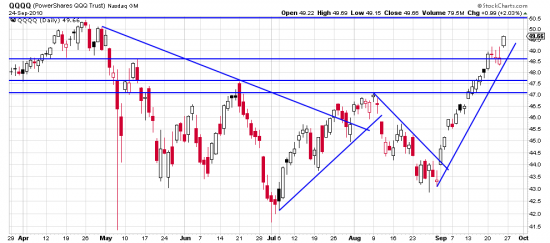
18 days of upwave in the Qs, and more importantly takes out the high indicated by the horizontal line. While downwaves are overdue in these markets we suspect that the weakness of the three day down wavelet should allow the market to run next week.
Wonder what ever happened to that large head and shoulders formation people were talking about?


Since the transport average on Friday did not go above its previous high (as did the industrials), plus the many gaps in the QQQQ, it would seem that a downwave will have to occur before the April highs can be crossed (if at all).