http://stockcharts.com/h-sc/ui?s=$SPX&p=D&yr=1&mn=0&dy=0&id=p62881197949&a=207879904
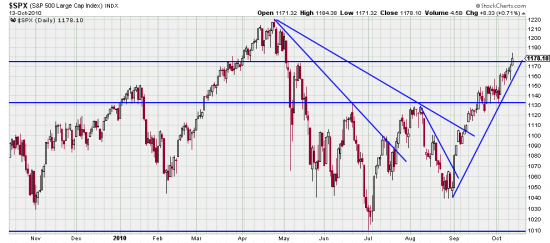
Two things are noteworthy about this chart (and the market). The first is that May’s high has been taken out. (A note about that noteworthy occurrence: Magee thought that important trendlines should be pierced by 3% to be definitive. That’s why we have Basing Points. And, we don’t wait for that to increase our positions. In this case we would hang back and not add on, due to the length of the run without a downwave — 34 days — not to mention inchoate suspicion. Or maybe paranoia. GLD is 54 days and SLV is 38. When they give us money like this we get suspicious.)
The other noteworthy thing is that the trend looks healthier now. We constantly teach that every upwave must be followed by a downwave — or a sidewave. In this case the drift, or sidewave of late September has enabled us to construct a more reasonable trendline.
Nonetheless we suspect that we are approaching some sort of conclusion. Price is accelerating and we are approaching the formidable psychological resistance high of April.
Anyway, we wonder what happened to all those double dippers and head and shoulders analysts who were busily getting short. Hmmm. Maybe part of this wave is those same people covering their shorts.
The Buddha is reported to have said, Enlightenment is not difficult if you have no fixed opinions.
Just off hand — and not a product of analysis, but of experience, we think there may be about 5 to 9 more days here before something new starts up. But don’t get complacent. It could be tomorrow.


