http://stockcharts.com/h-sc/ui?s=$SPX&p=W&yr=1&mn=0&dy=0&id=p10598217450&a=268628380
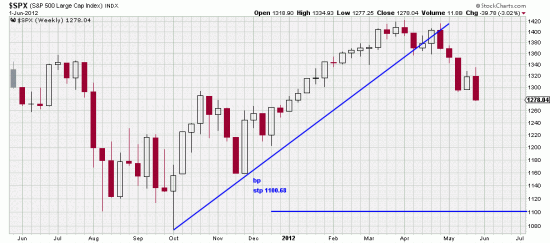
We have often demonstrated that the long term view of the market is not expressed in daily bars. In Sacred Chickens… we documented the power of weekly bars as a method to discard noise in the market and serve as a Dow Theory length trading method. Just as we filter hourly and intraday noise by using daily bars we can do the same with weekly bars. There are two methods to use to determine the end of momentous trends — the breaking of the long term trendline and the violation of weekly Basing Points.
Usually these two phenomena are accompanied by a recognizable chart formation — a head-and-shoulders or double top, etc.
We usually use daily Basing Points because of their greater sensitivity — they place a stop closer to the market and ameliorate the pain of drawdowns. And they are perfectly valid — especially so since we have methods for reentry when downwaves have run their course. But for the truly tranquil investor who views downwaves as transient phenomena — which they are — the weekly bars really express the state of the market.
In the weekly SPX chart above the weekly Basing Point stop is illustrated, and the reader can see how much space is given the market. The daily stop has been hit, but the bull market is not over. What we have is noise and volatility exacerbated by Greeks bearing bonds, Spaniards throwing a spanner in the works, and Germans pinching pfennig.

http://stockcharts.com/h-sc/ui?s=$INDU&p=W&yr=1&mn=0&dy=0&id=p01038580959&a=268628424
And yet, withal, we can struggle against our fate, like flies caught in a spider web, and attempt to cushion the drawdown by hedging. We’ve done it a number of times lately. And in fact are hedged now. We remarked on hedging in our recent post to edwards-magee googlegroup.
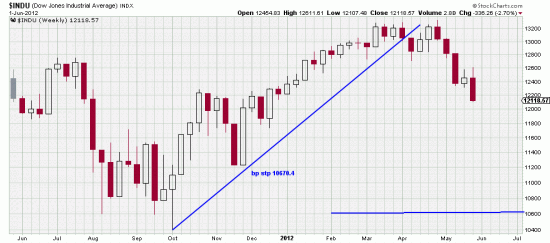
Here in the Dow we see esentially the same picture as the SPX. We have not drawn it here, but the crucial trendline is from March of 09, which presently is at 11766. These charts indicate to us that the present downwave is intended to cleanse the market of any remaining general investors before starting the next leg up.
But it behooves us to be alert and survive over the short run. The PnF charts which have a disconcerting tendency to be predictive are bearish in the short term.

 Friday’s action broke the 200 day moving average, a holy icon for some investors, so Monday may see more selling. But of course it depends on the full moon, the eclipse, the transit of Venus and what Angela has for breakfast (not humble pie).

