
http://stockcharts.com/h-sc/ui?s=$SPX&p=D&yr=0&mn=6&dy=0&id=p16768279576&a=214966864
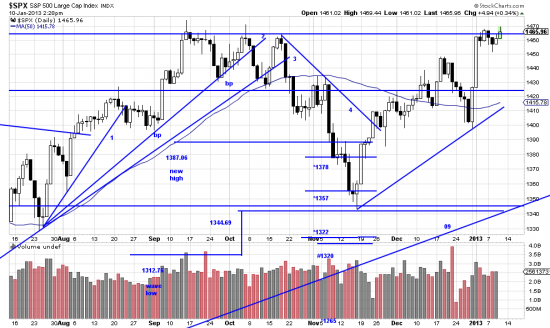
Actually, nothing strange about this chart, except that it pictures a rocket lift off, 64 points in two days — 90% updays. As we often take extreme powerbars like these to be signals the bullish tint of the market is reinforced. And the sideways drift since? Never prediagnose a pattern the master said….but… If that is a flag forming then the target here would be 1526. Which brings in some other considerations — that a flag could be the end of the wave. But — plenty of time to worry about that later. Right now the way to be is long. And we’re all in as they say.
Strange chart may be a misnomer, but there is certainly an interesting chart since Mar 09:
http://stockcharts.com/h-sc/ui?s=$INDU&p=D&yr=4&mn=0&dy=0&id=p96882828124&a=288585496
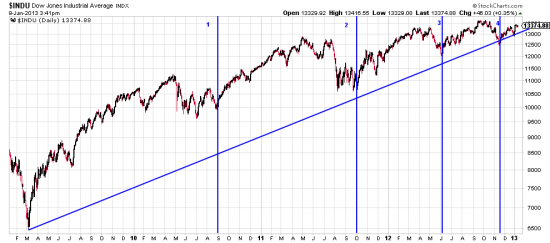
This could turn out to be an extremely important chart. Since Mar 09 the market has surged up in, as marked here, 4 waves, each succeeding wave of lesser power and amplitude. The weaker latter waves are playing hop-scotch with the most important trendline in the market right now– that originating in Mar 09. The piercing of this trendline will be a major major event and will require major portfolio adjustments. It is a virtual certainty that the line will be broken.
Now that we have your attention —we will be addressing this subject in coming letters.
Happy New Year.