
 http://stockcharts.com/h-sc/ui?s=$SPX&p=D&yr=0&mn=3&dy=0&id=p43940581799&a=214966864
As certainly as there is a high tide, there will be a low tide. As certainly as equity peaks it will experience lows. Waves ebb and flow. The higher the wave the more powerful the outflow. We will all remember the films of the East Asian tsunamis — with the huge wave crashing in, and then the sucking outflow carrying houses cars trees — anything not secured.
We find these metaphors to be highly descriptive of market tides and waves.
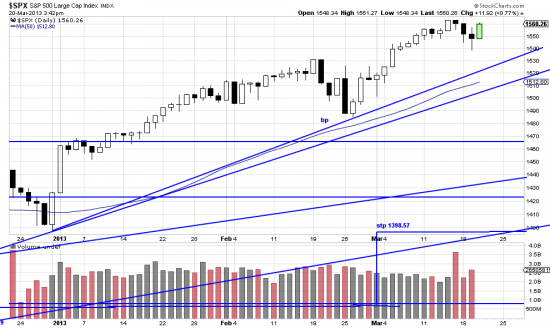
At the moment the tide is rising, as we see it. The wave is coming in. In the market a rising wave excites contrarians. As the wave proceeds contrarians become more and more anxious and tense. They will always start trying to catch the leading edge of the wave to short it. There is certain practical basis to this. That is, profits are made much faster on the downside than on the upside. And a strong downtrend is much more reliable and predictable than an uptrend. So regardless of the length of the wave (within the wave within the wave) contrarians will be attempting to stop and reverse it.
We are seeing one of these down wavelets right now. Contrarians have been finding reasons to doubt and short the wave which began Jan 1. (The longer a wave goes uninterrupted the itchier contrarians get.) Cyprus was the signal that the counterwave could begin. Berlusconi and the Italian follies were the previous excuse. Many bears predict a 50% retracement. This will not happen. (The chart pattern is not right for it– you can verify that by looking at the long waves which preceded the last few bear markets.) In powerful bull markets downwaves are weak and relatively short.
But — enough of theology. Let us get back to the apple of things, as Newton said.
 http://stockcharts.com/h-sc/ui?s=AAPL&p=D&yr=0&mn=9&dy=0&id=p67027165099&a=289294116
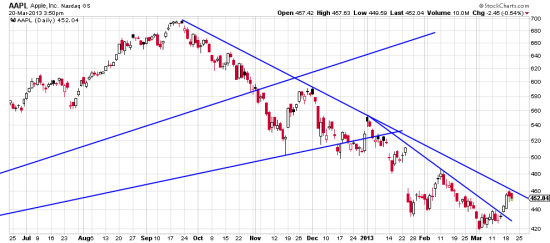
Today’s WSJ publishes a chart of Apple which shows the long downtrend line broken and wonder of wonders (does this mean they give some credence to technical analysis?) implies that it’s safe to eat the apple again. We’ve looked at several different charting methods and can’t see the line broken. But we can see the short term line broken and we can see a trade there. We would use a money management stop — 6 to 7%. And we would watch it closely.