
http://stockcharts.com/h-sc/ui?s=$SPX&p=D&yr=0&mn=8&dy=0&id=p50934119130&a=266398464
Sometimes there is nothing for it but to cast the I Ching — or the runes or the crystal ball or just to appeal to Congress for help. That last would be in vain for certain as they just gave us a budget guaranteed to be of no help to the economy. But we digress…
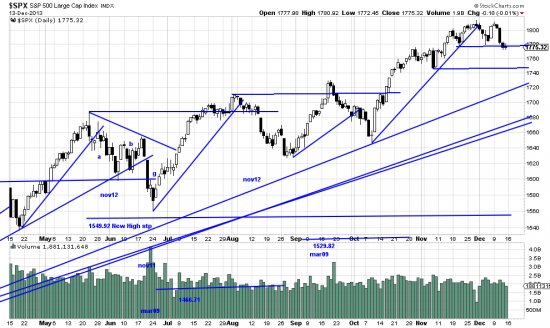
Obviously the market is going sideways, but how is it going sideways? Well, I Ching, pick up sticks… We have had about 18 days of advance and 29 days of sideways. Might not be so bad. You will remember that there are two possible reactions to an upwave: a downwave or a sidewave. A sidewave serves the same purpose as a downwave but with fewer tears. So there is nothing in recent data to change our bullish stance.
What there is is (are) some technicalities: 14 of the Dow stocks are below their 50 day moving average; the last 11 days in the SPX have lower highs and lower lows. (As this is within the sidewave the effect is ameliorated, but taken with the Dow stocks it is worth noting.) We did some adding on to our SPX positions but we really think it would be wiser to wait for the highs to be taken out.
We hedged part of the SPX and then unhedged and in general chased our tail in a circle. Don’t do this at home. And, as Ella Fitzgerald says, Do nothing till you hear from me.