
Barely had we sympathized with Dennis Gartman that the market was going irrational when prices turned around and made it safe to go back in the water — with some caveats. Whew. What was that? Oh, just a passing squall. Yesterday PnF charts registered breakouts as shown here.
(no link — go to stockcharts.com)
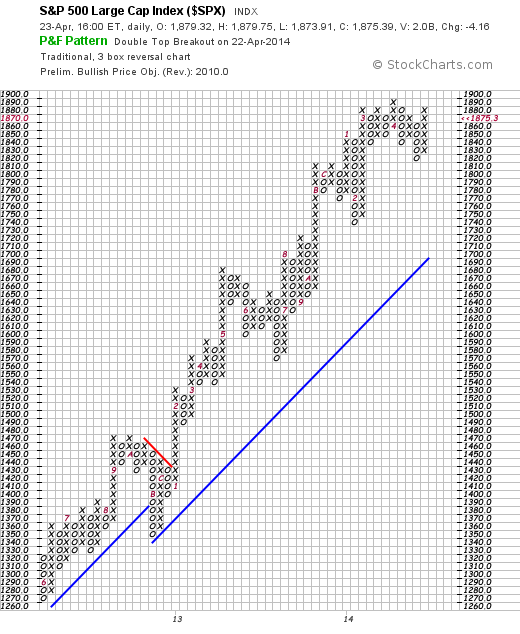
As may be seen not only have the SPX prices broken out, the PnF method is targeting 2010.0. We think this is not only possible, but probable — but please not to forget that at some point here (sell in May and go away…) the market will have an anxiety inducing break. Our merry disregard for old chestnuts like “Sell in May” (We could say contempt…) remains unshaken and is an excuse for not doing what the chart says to do.
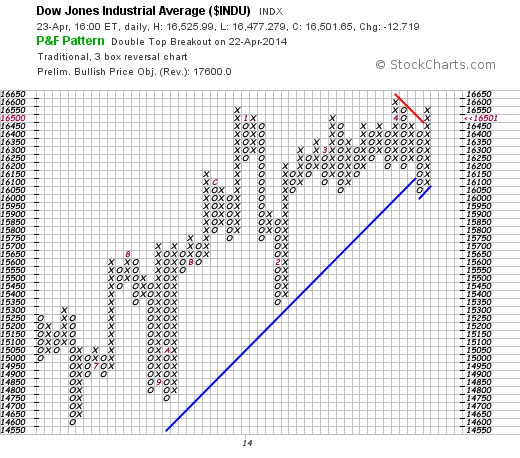 If you believed in market nostrums you would be casting away opportunities. The INDU chart shows a similar disregard for the nostrum, looking for a target of 17600 for the Dow. Meanwhile the COMPQ bounced off the trendline and started looking more healthy.
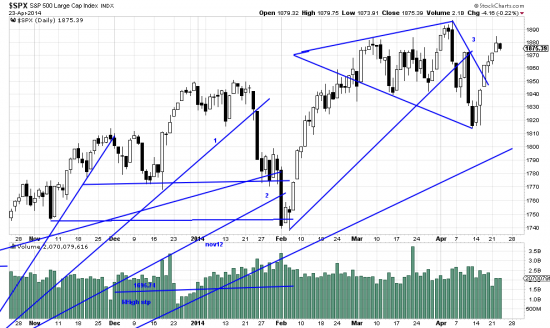
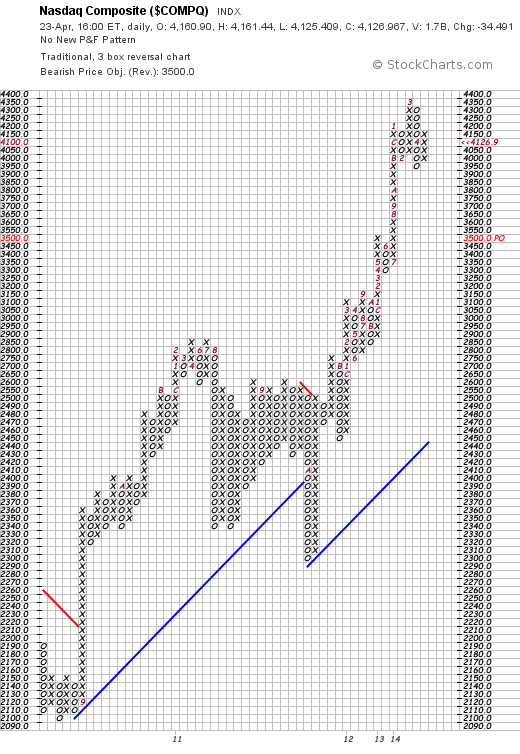 The COMPQ is not out of the woods. The PnF chart is still looking for a bearish price objective of 3500, but the bar chart shows prices recovering. In fact all three of the indices look like they are in the alpha-beta-gamma-zeta pattern, with the present wavelet being the z wave.
http://stockcharts.com/h-sc/ui?s=$SPX&p=D&yr=0&mn=6&dy=0&id=p83257770514&a=266398464
Here at number 3 the trendline is being broken by the z wave. This pattern is common to the indices and many other issues. http://edwards-magee.com/?p=3803 or http://edwards-magee.com/ggu/alphabetazetawaves.pdf
The market is not in the clear by any means. That will not happen until we clear these formations and make new highs, but from all the evidence this downwave is over.