
http://stockcharts.com/h-sc/ui?s=IWM&p=D&yr=1&mn=0&dy=0&id=p42567425598&a=350518198
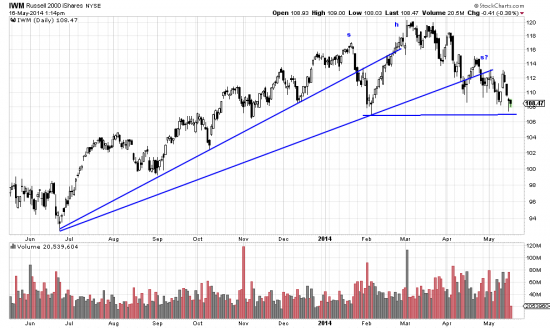
The most superficial examination of the IWM reveals details with negative implications. A two month downtrend is obvious and prices are approaching the horizontal trendline. This trendline may well be the neckline of a mutant head and shoulders formation. We have marked the head and shoulders (h-s-s). Regardless of whether the formation is a head and shoulders or not it is decidedly negative and worth a short if the horizontal line is taken out decisively. Adding to the negative case is the breaking of the trendline from July13. Always a screaming signal to the technician. We would put the stop about 2% above the last wavelet high.
 http://stockcharts.com/h-sc/ui?s=QQQ&p=D&yr=1&mn=0&dy=0&id=p29088941710&a=350515648
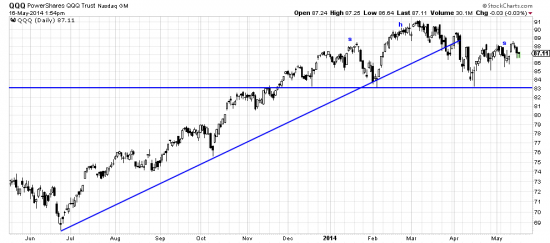
The Qs are in somewhat the same situation. There is a possible head and shoulders (a more regular formation) but prices would have to descend to pierce the trendline. Nonetheless a trendline from July13 is broken so prices are almost certain (as far as anything is certain in the market) to decline. A no brainer short if the horizontal trendline is broken with authority.