
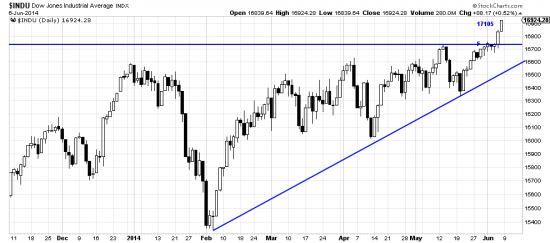
http://stockcharts.com/h-sc/ui?s=$INDU&p=D&yr=0&mn=7&dy=0&id=p59103334454&a=298224028
After five months of sideways markets prices broke out and are now accelerating. It appears that the present markets are being characterized by many flags. Here in the Dow F marks what might be a flag. The interpretation is reinforced by patterns in the other indices:
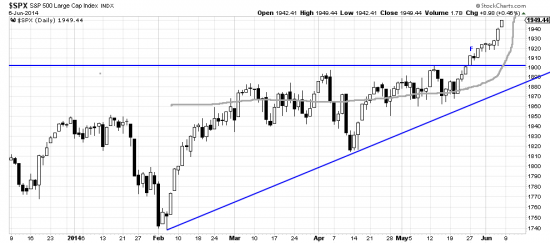
http://stockcharts.com/h-sc/ui?s=$SPX&p=D&yr=0&mn=6&dy=0&id=p90011170908&a=266691158
The SPX also displays what might be a small flag (F). The hand drawn line implies that prices are going parabolic. This is entirely possible. The inevitable result of a parabolic price rise is a disastrous collapse. If these are flags the top of the flag should mark the top of the wave and the beginning of the collapse. The rule of flags is that the “flag flies at half mast”. (To derive target measure the bottom of the mast and then assume that the breakout from the flag will equal the number of points of the bottom part.) The measurement for the SPX is 1971.
A critic might cavil that these are speculative analyses. The interpretation is reinforced by the pattern in the COMPQ. Also, incidentally AAPL appears to have put in a flag. So, as Evelyn Waugh would say…
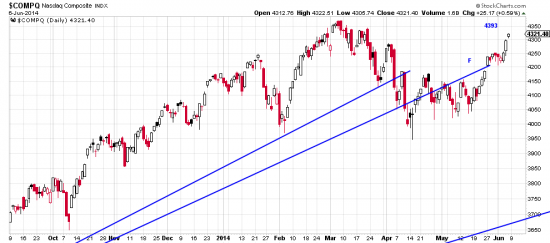
http://stockcharts.com/h-sc/ui?s=$COMPQ&p=D&yr=0&mn=9&dy=0&id=p83734532164&a=234482827
In the COMPQ the formation looks to be clearly a flag. The measurement target is 4393.
What should play out here is the accomplishment (more or less m/l) of the targets and then a collapse of prices but close attention is demanded as there might be a consolidation. Nevertheless it would be wise to plan for the worst and watch closely over the next several weeks.
Remember we disavow predictive powers. What we have described here is an interpretation using the tools of classical technical analysis. The ultimate test of the analysis comes when the croupier says, “Les jeux son fait.”
The bets are made. We will be acting on this analysis to hedge our positions if events unroll as expected. Readers should lay plans if this analysis plays out. Inverse ETFs or puts, or futures may be utilized. We also think that price retracement will not be sufficient to change the major trend.