
http://stockcharts.com/h-sc/ui?s=$SPX&p=D&yr=0&mn=6&dy=0&id=p83257770514&a=266398464
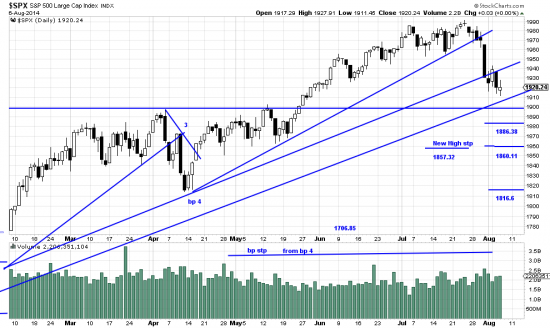
Since there is not much you can do when your opponent has you in a headlock and is hammering you we tried to figure out how bad it could get. First of all, if you take the formation depth it’s not bad, in fact we might already have seen the end of the wave, as the target is 1914.33.
On the other hand if you run a Rule of Seven on the first wave down you get the targets we show on the chart: 1886.36, 1860.11, and 1816.6. At this time we think these are unlikely, and we think the New High stop shown is only for the most chary investor. The wave low stop is where the conservative and determined investor is. The likelihood of a severe downwave here is very limited in our opinion. Note, this is an opinion, not an analysis. But we back it up by being very skeptical since there is not a real top formation here commensurate with the strength and length of this bull market.
We think half the trading world is champing at the bit on the sidelines waiting for the least excuse to jump back in. Maybe more than half. But at this moment we think we are still in the A or alpha wave. Meaning we need a rally and then a test of the low. We do have a trick to get around that, which we will explain in time. Right now the proper posture is….waiting.
A P&F Chart count of this recent move gives me a target of 1890. Of course if we break below major support, 1820, the downside target gets much larger.
Harry