
http://stockcharts.com/h-sc/ui?s=$SPX&p=D&yr=0&mn=6&dy=0&id=p99378568549&a=266398464
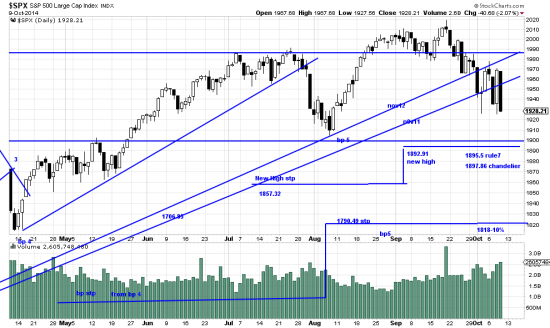
We are fortunate in having alert and sharp readers, one of whom pointed out that a 10% downwave would reach 1818, not 1888. We have corrected the chart and resolved to stop doing math in the head. 1818 would put prices on the razor’s edge of systems trend change. In an attempt to gauge the implications of the present downwave we ran several analyses. If we took the depth of the formation (115) and subtracted (with a calculator) it from the low of the formation we could get a target of 1789. If we used the rule of seven, taking the first short wave as of September, we get targets of 1963.8 to 1895.5. The first three targets of the rule have already been overrun and the major target clusters with the chandelier stop and the New High stop. This seems a likely target, but not much result for the breaking of major trendlines.
On the other hand the strength of the bull trend is so powerful that amazing daily moves have taken place the last 15 days or so. The market gets smashed one day and the next day it roars back. This indicates that uneducated money is eagerly buying knock down prices, not realizing the danger involved. The way we look at it is smart money is driving prices down and naive money is jumping in to drive them up. The smart money will soon confront the problem of how to reenter.
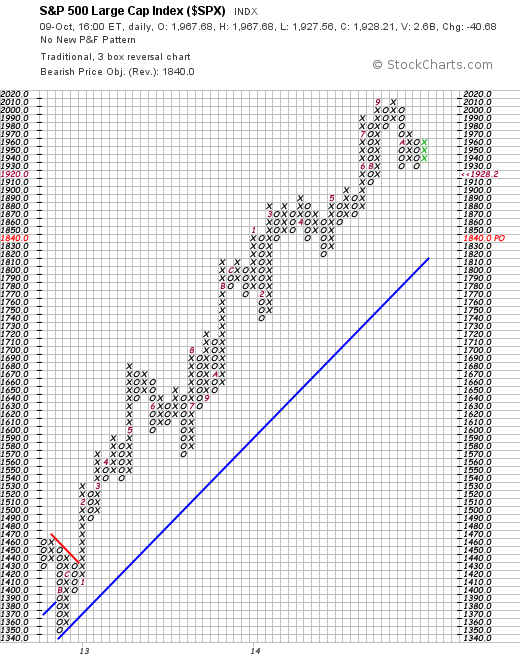
The PnF chart has a dim vview of things, looking for a target of 1840:
These are extremely difficult markets to analyze and diagnose. The most prescient anlysis we can offer is what is both a cliche and an eternal truth: the present trend tends to continue.