
http://stockcharts.com/h-sc/ui?s=$SPX&p=D&yr=0&mn=6&dy=0&id=p22775897357&a=266398464
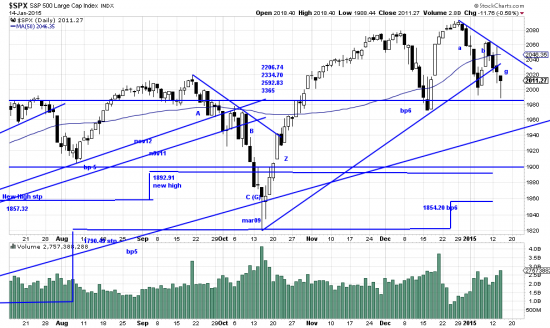
A wave that transverses 50 or 60 points (or 400+ in the Dow) is ample antidote to boredom. The question is, is, is it bearable? The answer is that it is bearable if you are a long term trend trader. Nevertheless market volatility is enough to raise the eyebrows — if not set the scalp on fire. Looking at the chart we can see how far away this nonesense (or trader panic) is from significant trend stops. Pundits now are saying (braying) volatility like this is the new normal. Not.
Not because volatility reverts to the mean — always has, and will in this case too. Readers should look on these conditions as the market dislodging weak holders. The purpose of chasing weak holders is to set them up for the last act, which is, they recover their courage and jump back in the market to help form a top and lose the rest of their money.
We have labeled the wavelets here, alpha, beta, gamma, gamma testing the previous low. (http://www.edwards-magee.com/ggu/alphabetazetawaves.pdf). Based on today’s action it appears that the low has held. The next wave is the zeta (or recovery) wave. When the trendline is broken it is a buy signal.
At the moment we think the z wave should start tomorrow (Thursday). Better, because we added on to our UPRO position at the bottom today and lifted most of our hedge. If we’re wrong we’ll correct it tomorrow. Calmer readers should have watched with interest while the herd stampeded. Be one of those, not an ADHD trader.