
http://stockcharts.com/h-sc/ui?s=GLD&p=D&yr=2&mn=9&dy=0&id=p43220082674&a=255869372
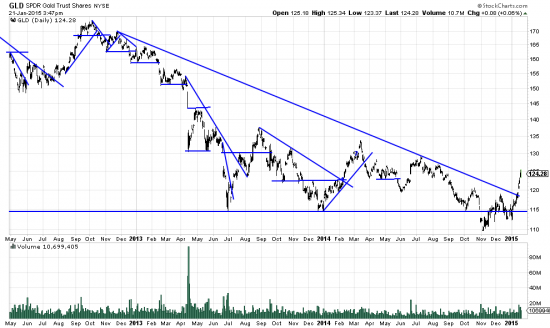
We have been watching gold with deep skepticism. But it is true that GLD has broken a very important long term trrendline, and given off a buy signal as shown in the following chart.
http://stockcharts.com/h-sc/ui?s=GLD&p=D&yr=0&mn=6&dy=0&id=p50004896245&a=234983962
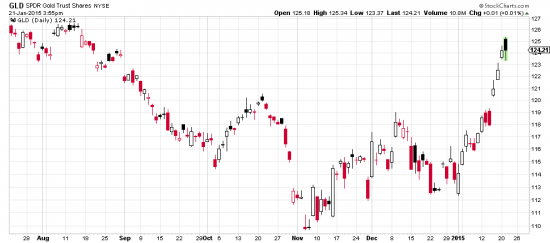
Here is the source of our suspicion: GLD has gone parabolic. And this most often leads to a fall. In addition there is a gap at the top of the chart which may be portrayed as an exhaustion gap. There is a breakaway gap also, which contributes to the interpretation of the last gap as an exhaustion phenomenon.
But ever faithful to the chart we have put on a very small position in the issue. This would be the thing to do if one wanted to participate. Divide alloted capital into three to five units, starting small with one. If it collapses it won’t hurt that much, and if it continues you can always add on.
http://stockcharts.com/h-sc/ui?s=$SPX&p=D&yr=0&mn=6&dy=0&id=p22775897357&a=266398464
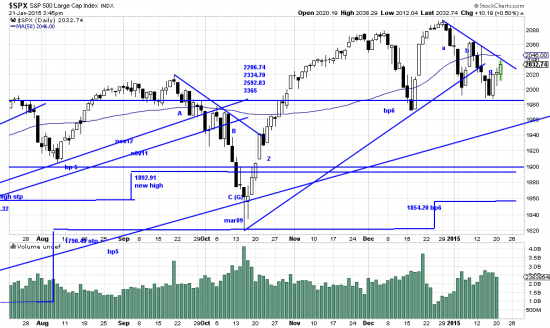
Once again we are suspicious of the SPX pattern and there has been behavior (or misbehavior as Mandelbrot said) to justify our discomfort –namely great volatility intraday. But now it seems that the Z wave is in process and the analyst has to take the chart as is even if uncomfortable. Our discomfort is reflected im the fact that we still have a partial hedge on. But we also are pretty much all in in the UPRO. For the conservative investor the breaking of the trendline would be the add on signal.