
http://stockcharts.com/h-sc/ui?s=%24SPX&p=D&yr=0&mn=3&dy=0&id=p76611673066&a=266398464
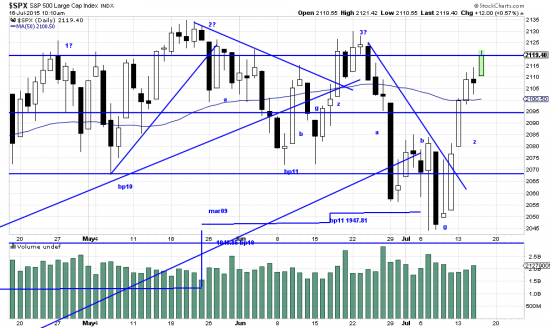
Readers at this point hardly need us to point out the shape of the present formation. It is, of course, the alpha-beta-gamma-zeta formation. And most of the time when it is recognized it means the market is recovering and buying is in order. The waves are marked here –a-alpha, b-beta, g-gamma and z-zeta. The more venturesome one is the more profit is reaped, for example buying when the downsloping trendline is broken. Considering the grief we have seen lately and the utter subjection of the market to news we were in hurry to jump on the wave. And even now, old scarred investors wait for the high at 3? to be taken out. As for that high, in our opinion that formation was a valid head and shoulders but was overcome by buying enthusiasm (and never fulfilled its evil bearish intent). Some of that enthusiasm is happening right now. We have watched suspiciously because some of the jungle drums we listen to claimed that there was a coordinated bear campaign going on.
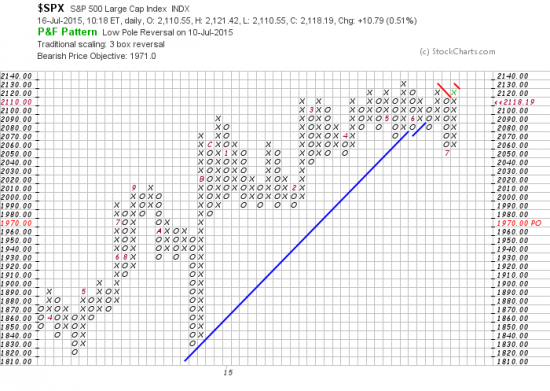
Some of the grief we spoke of is reflected in the PnF chart which has not yet caught up with market facts and still shows a bearish target. We will have further thoughts on this chart in the near future.
http://stockcharts.com/freecharts/pnf.php?c=%24SPX,PWTADANRBO[PA][D][F1!3!!!2!20]
This chart, which shows a lot of back and forth now will act as a powerful base for the next leg up — as we will further discuss when we comment at length on the PnF.
While this present candle formation looks like a signal for the entire markete (it is) there are other buying opportunities — : the Qs look very buyable. On the other hand the gold and the gold miners look like good shorts, as does silver. The Chinese issues look like obvious shorts, but that is quite possibly playing with fireworks (their invention). We have chosen not to.