http://stockcharts.com/h-sc/ui?s=%24SPX&p=D&yr=0&mn=3&dy=0&id=p76611673066&a=266398464
The present trend will tend to continue. Contrarians will continue to dominate the market. Donald Trump will divorce his wife and marry Kim Kardashian. (Just wanted to see if you were paying attention.)
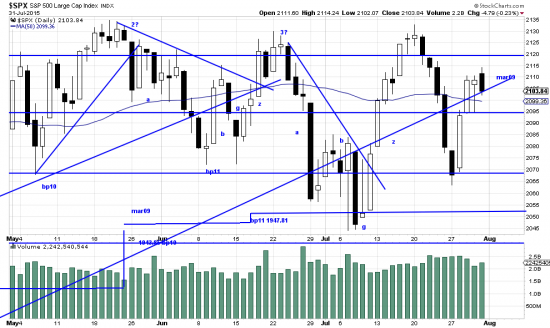
Quick. What is the salient fact on this chart? The market is more than just flirting with the mar09 trendline. It is now dancing all over it. In all our experience broken trendlines of this significance result in crocodile tears. We would examine our portfolios carefully looking for hedge and defensive issues. And we would calculate carefully the risks here. The operational risk is the distance between the market price and the Basing Point stops, or whatever other stops you have adopted. If you don’t have stops you are the legitimate prey of the market.
(Note that you have to confirm the trendline break — as for example with the break of a Basing Point stop or a close 3% below the line.)
We expect, if there is a sell-off it will be sharp, sudden and violent and easily reach 6-10%. If you are adroit you might get yourself in position to make a profit on it. (SPXU or the futures.)
http://stockcharts.com/freecharts/pnf.php?c=%24SPX,PWTADANRBO[PA][D][F1!3!!!2!20]


I can’t help notice that some major individual issues are a bit twitchy. See AAPL, DIS, VIA, FOX, TWX. Is it shorting time in the Q’s yet? (a trade, just a trade…)
On reflection, do the Q’s look to you like a classic a-b-g-z formation today?