
http://stockcharts.com/h-sc/ui?s=%24SPX&p=D&yr=0&mn=6&dy=0&id=p38955316076&a=266398464
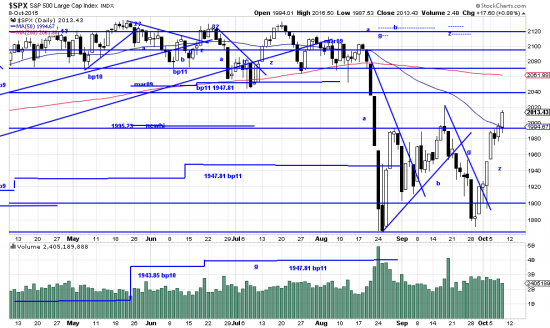
Eight days of constructive activity can salve a lot of hurt feelings. It can also do a lot to repair the chart. In fact we can now see some recognizable structure in the market after being bounced around like a pinball. We tried early on to find an a-b-g-z pattern after the flash crash. Now we think we can see it and have marked it in the price action and at the top of the chart. Meaning we think we are in a zeta wave now. As almost always we see the surge of prices across the trendline as a buying signal, and we have done that in our personal accounts.
Regardless, we are still in the box we described several letters ago, and this is a high risk area.
There are green shoots:
http://stockcharts.com/freecharts/pnf.php?c=%24SPX,PWTADANRBO[PA][D][F1!3!!!2!20]
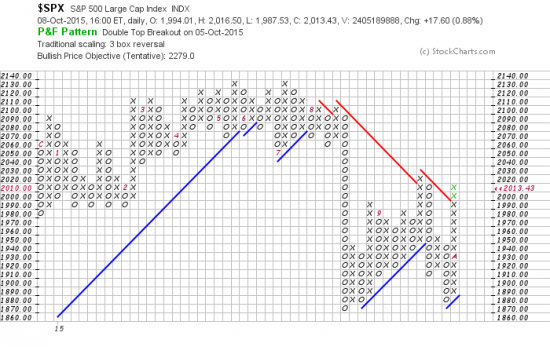
The PnF chart has turned positive and is looking for a target of 2279. And, while the Transportations have not yet confirmed the Industrials some interpretations of the Dow Theory have cast off buy signals.
Readers should be aware that in view of the recent formations we have a new situation in the market. We are now working to analyze this situation and formulate a strategy to deal with it. Letters on this subject will be forthcoming.
And of course Oct 19 is coming — the market’s version of Halloween.