
http://stockcharts.com/h-sc/ui?s=%24SPX&p=W&yr=2&mn=0&dy=0&id=p44892117966&a=432305978
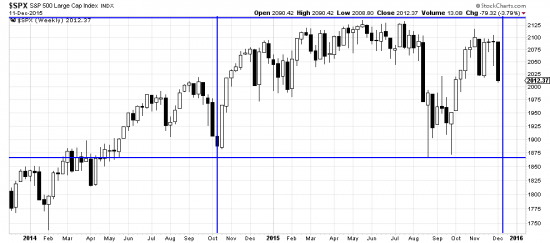
Over recent weeks we have discussed being completely hedged and of not undertaking any operations while prices were in the box (as above). (And it’s not a Xmas present box, either.) The holiday season is setting up to deliver us a lump of coal, and not just handed to us but hurled. On top of oil looking for a bottom 30,000 feet down, the implosion of high yield is casting a negative cloud over equities. We repeat our Clytemnestra wailing again here: Beware the ides of December and all other ides. And watch out for the machines — who some of our colleagues think are poised to destroy us. (Well, at the least they are making life uncomfortable.)
And, wherever it comes from, the market just sent us a very bearish signal.
http://stockcharts.com/freecharts/pnf.php?c=%24SPX,PWTADANRBO[PA][D][F1!3!!!2!20]
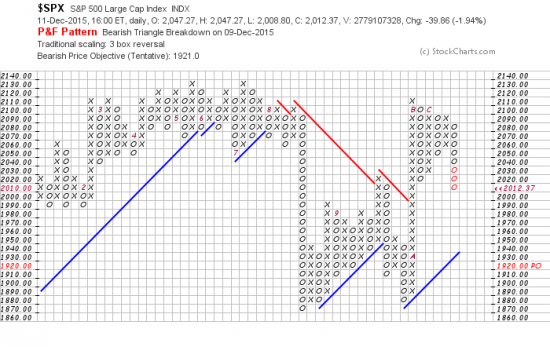
Sometimes interpreting the bar chart can seem anomalous. And looking at the PnF can clarify the analysis. Here a bearish break down from a triangle implies the market is on its way to 1921. We have expressed our agnosticism about this technical tool, but the present analysis ceretainly fits the picture of a market experiencing a perfect storm. And it certainly sends a message to market sailors to trim sail and watch out for difficult weather.
http://stockcharts.com/h-sc/ui?s=%24SPX&p=D&yr=0&mn=6&dy=0&id=p38955316076&a=266398464
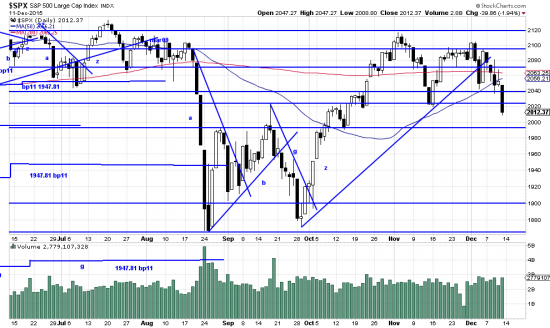
Here prices took out the recent low, fulfilling the broken short term trendline. As they say, beware of Greeks bearing bonds. (bearer bonds)
We bewared, trimming our SPX position and putting on the first stage of a robust SPX hedge with SPXU.