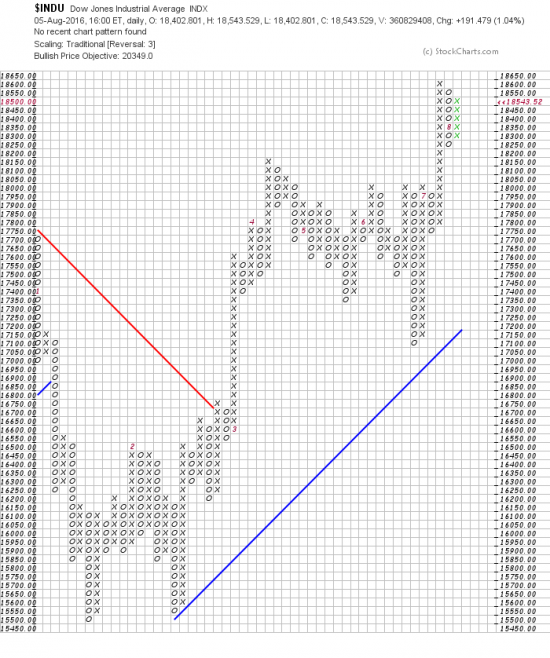
Goldman says take the rest of the summer off. Gross says what me like stoscks? Nyet. And Soros is supposed to have a big short bet on as is that corporate horse-fly Icahn. They are all getting poorer by the day. We have said, for the 3015th time, that having an opinion on the market is a good way to go broke, and that it is a fool’s errand to buck the trend of the market as plainly indicated by the chart. The PnF system looks for a target of 20349 in the INDU.
http://stockcharts.com/freecharts/pnf.php?c=%24INDU,PWTADANRBO[PA][D][F1!3!!!2!20]
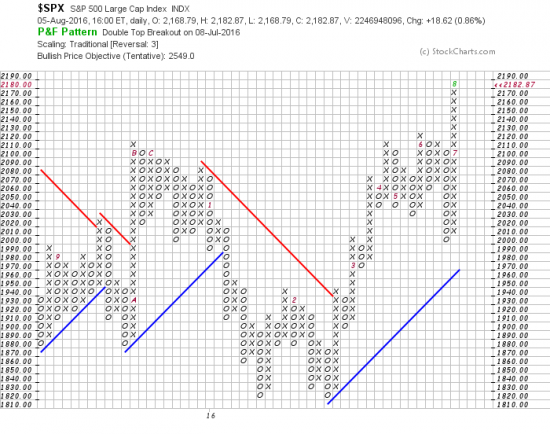
and 2549 in the SPX. To the point, look at how prices have broken away from the congestion zones. Of course there will be pauses or corrections but the charts give a clear perspective of what is happpening.
http://stockcharts.com/freecharts/pnf.php?c=%24SPX,PWTADANRBO[PA][D][F1!3!!!2!20]
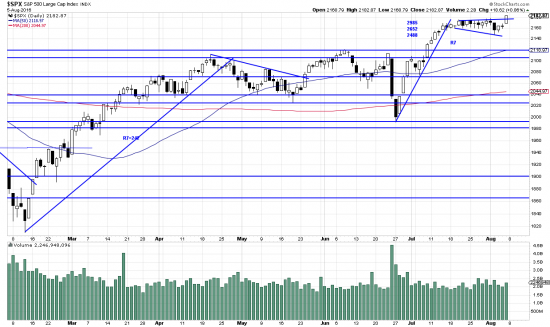
The SPX chart looks like it put out a flag after an explosive little run. Friday prices broke out of the flag and that is bullish behavior.
http://stockcharts.com/h-sc/ui?s=%24SPX&p=D&yr=0&mn=6&dy=0&id=p70142979615&a=266398464
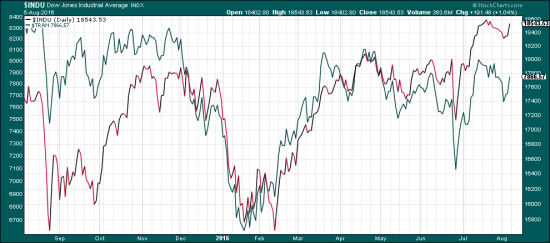
On the side of the bears is the Dow Theory, which is suffering what theorists call a “divergence”. This occurs when one index (TRAN, INDU) makes a new high and the other lags in making a new high and confirming the first. This is not a Theory sell signal, but a caution light. We include a comparison chart which clearly shows this.
 We added on to our UPRO positions. (Not recommended for readers unless leverage and the idiosyncrasies of etfs don’t bother you.)


