

It is interesting to note that during the recent sell-off prices did not take out the very strong and long P&F trendline. We won’t go into the niceties of P&F charting except to say that trendlines have the same import as bar chart trendlines. In fact it might be said they are marginally more powerful because of the P&F chart’s filtering of noise.

In fact the chart is an excellent presentation of the context of the markets, and shows price bouncing off the long term trendline. The subsequent price recovery is also well illustrated by the columns of Xs. The explosive nature of the recovery is shown by the candlestick chart. Just as the volatility of this period was breath taking, the pace of the recovery has been blinding. In 17 trading days price has traversed approximately 325 points (basis SPX).
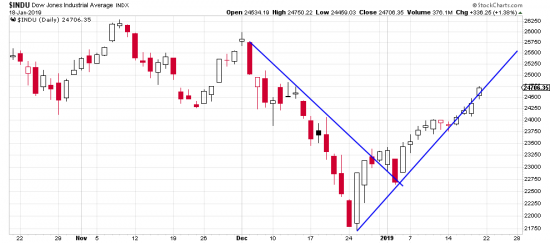
The INDU reveals even more about the market. The short term trend has accelerated almost out of control and become quite steep as shown by the line interesecting the prices.
We would expect a reaction here but in fact Friday’s action showed a buy signal, including a minor gap. Ordinarily we would have reentered where the downtrend line was broken. But we remained on the sidelines deeply distrustful.
We are still distrustful, but eventually you have to do what the chart dictates. And right now it is dictating that long is the way to be. We are guided by our principle that if the market turns on us we can always exit.
So next week we will begin scaling in to the market if conditions remain stable. We will stop the position 1% under the day three days preceding Friday. This is a trade stop, not a trend stop.