
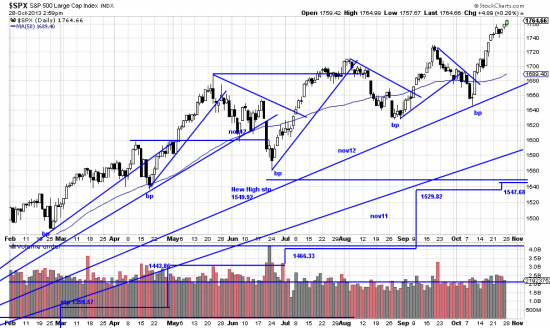
http://stockcharts.com/h-sc/ui?s=$SPX&p=D&yr=0&mn=9&dy=0&id=p20049953156&a=214966864
Here is our basic chart where we see a new Basing Point and raised stop. Each of these stairstops means more profit locked in. This could be very important considering what we will consider next –namely sky’s the limit. We checked out the PnF charts at stockcharts.com and came up with the following:
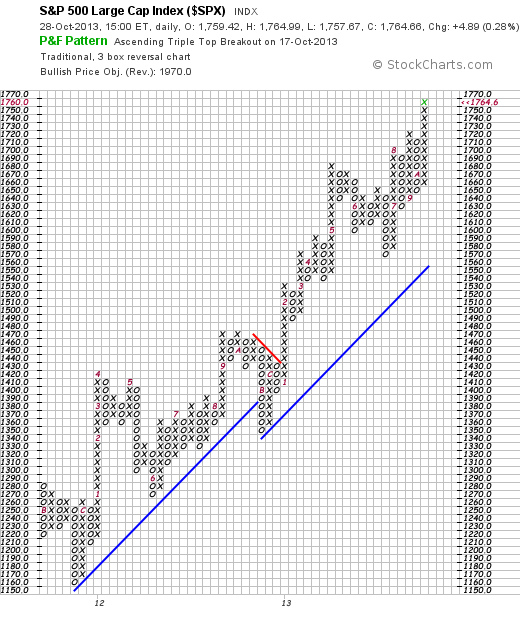
go to stockcharts to find this chart
The PnF system looks for an objective of 1970, as shown. Is that realistic? Who knows? But what if we are in the bull market of our lifetime? When you get a fat pitch you have to hit it out of the park. Buttressing this case is an analysis we just ran: The rule of seven. We ran a rule of seven on this market from the beginning. Don’t know why we didn’t do it sooner. But it has a price objective much like the PnF chart.
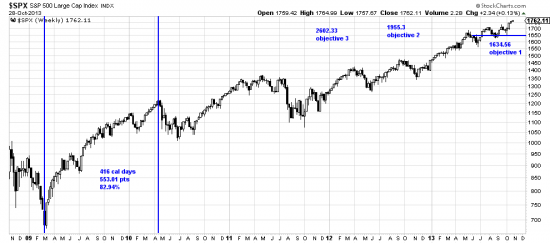
http://stockcharts.com/h-sc/ui?s=$SPX&p=W&yr=5&mn=0&dy=0&id=p38441387569&a=321281297
The initial wave here is marked by the vertical lines. 416 calendar days, 553.01 points, 82.94%. Running the Rule of 7 on this wave we get objectives of 1634.56 (already passed) 1955.3 and 2602.33. (edwards-magee.com/files/ruleofseven.pdf) We include the last with some trepidation as we don’t want to panic readers. And, as we have remarked numerous times, we don’t believe this. It’s just an analytical tool. The tool doesn’t tell you how many speed bumps there will be on the way to Dow 36000. But there will be, and besides even if the tool predicted 3000 SPX we would be out in a trice (a trice is a small 3 wheeled Italian moto) if a stop were penetrated.
You may use this letter on Halloween to frighten your unenlightened friends.
Pingback: S&P 2602.33? Once again stepping into the dark waters of mystery… | Technical Analysis of Stock Trends