
http://stockcharts.com/h-sc/ui?s=$INDU&p=D&yr=0&mn=6&dy=0&id=p62060422991&a=205639989
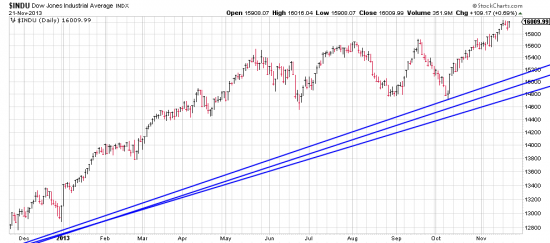
An important psychological barrier fell today as the Dow closed above 16000. Here a close up of the Industrials. The three humps here represent a base which should impel the Industrials upwards. Conventional Point&Figure chart analysis says the immediate target is 16200. We think it is probably much higher and are working on the analysis. The three trendlines are fro Nov11, Nov12 and March09. Why are these severe downwaves always in November? Just joking. It’s because the market usually gets hammered in October.
http://stockcharts.com/h-sc/ui?s=$INDU&p=D&yr=0&mn=7&dy=0&id=p38041005120&a=298224028
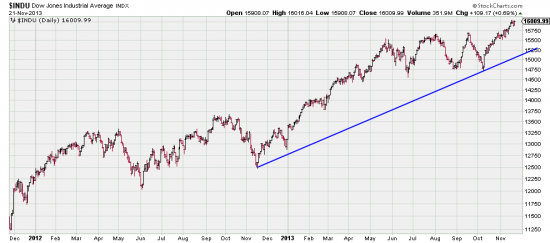
Worth noting that there is no short term trendline. You will remember we tried to invent one recently but the truth is there is none. As we usually base our analysis on the S&P here is the usual chart.
http://stockcharts.com/h-sc/ui?s=$SPX&p=D&yr=0&mn=9&dy=0&id=p20049953156&a=214966864
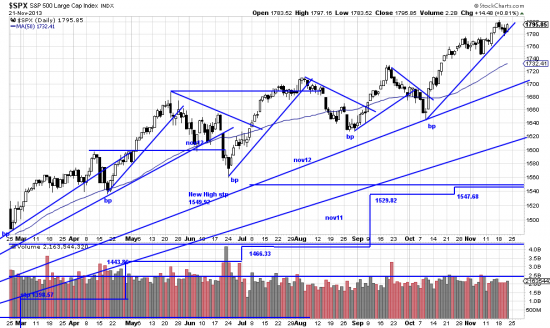
The SPX PnF looks to a target of 1970, which we think more appropriate for the Dow also. This chart shows the short term trendline we cobbled up. Perhaps a trendlie too far. Still the market is is extremely skizzy — blown hither and thither by fears of the Fed, fears of shadows, and fears of fear itself. At the moment we don’t see anything in the chart to be afraid of.
What markt activity would start to concern you aside from the trendline break…
An extremely difficult question. Because I usually am thinking long term, so what exactly happens at the top hasn’t concerned me too much. But I’ll try to analyze what I’m thinking. First prices stall and back and fill, drift sideways, slow down and after awhileno new highs are made. There might also be patterns such as a key reversal, or a power bar down. After a certainn aount of this a pattern of lower lows and highs is made. Of course this is of little use to the log term investor. But for the trader important information. Some technicians think you can see these patterns developing on the hourly chart. I will give this more thought and write something about it.