ID Bar
Index headline

Session 1:

MTA Review of 9th Edition

Chart Analysis Drill 1

Personal information form

System Notebook Section dividers

Steps in Constructing the Systems Notebook

Session 2

Chart Analysis Drill 2

Basing Point blank charts:

(for solution to compare with charts in StairStops)

Chart 1

Chart 2

Chart 3

Chart 4

Chart 5

Chart Analysis Drill 3

Chart Analysis Drill 3

Session 4

System 1 CIS

System 1 trades

System 2 System PB --Position Builder

System 3 System Kook -- Scale in Scale out

System 4 150 day moving average

System 5 : See Turtles Appendix TAST 9

Session 5

Recordings: Session 2 Session 3 Session4

get these in class as uploading has proved difficult.

Risk is a spherical porcupine. Don't handle it barehanded. Construct a machine to deal with it.

Session 6

Mandelbrot

knowing when to sell

Risk Management software. Get this in class.

Risk (RRR, etc)

Cases:

Drill 2, 1

Drill 2, 2

Session 7

Von Waldburg Talk and Chart Dreiss valid trend line Diagram

LONG TERM YIELD (80 MONTH MA)

Session 8 - 10

Wyckoff buying tests

Moving Average Article

Wyckoff selling tests

Prechter article on successful trading

Session 13

von Waldburg Fractal Wave Algorithm

Principle of Changing Cycles

Session 14

Final Case

1

2

3

4

5

Events Listing

2 1/2 DAY SEMINAR

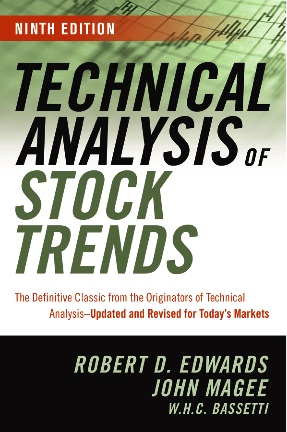
TECHNICAL ANALYSIS OF STOCK TRENDS

Being Scheduled tentatively for

September 2007


Kiss and Kry and Kibitz with Carnac

Stock analysis workshops


One Day Total Immersion Workshop

in April. Intensive and rigorous drill

in natural trading methodology.


FI498S

Golden Gate University Graduate Seminar

Building Effective Trading Systems

May to August