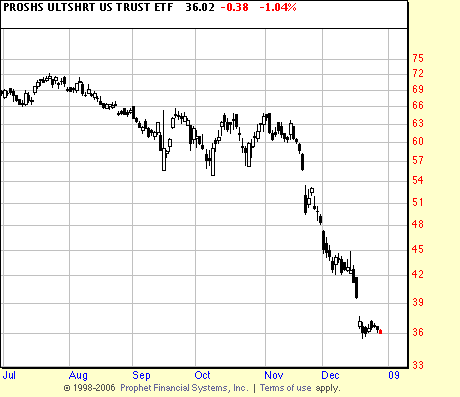
We remarked that the bond chart got our short glands hyperventilating. We shorted the bonds but didn’t really give a good accounting of the analysis. Here is a chart with the analysis. Now there is something going on here that the intelligent reader should consider. (We consider all our readers intelligent readers. After all you could be off listening to the analyst (?) who predicted Dow 16,000.) That is the nature of risk. Risk inverts at major turning points. In other words after a panic sell off the risk has been drained from the market. Wykoff said that he often looked for the point of maximum danger to buy. In these cases the stops are obvious if you are wrong. In this case of the bonds the chart is clear, the curve is parabolic and there is a gap which may well be an exhaustion gap. Now, you can be wrong. It can go higher, just at a panic sell off can be followed by another panic sell off. But your stop should take you out in that case.
 Here is a point of great danger. The bonds have been running and could well run higher. But the pattern would seem to have fulfilled itself. A break above the highs, depending on its nature could take us out.
These bonds can be shorted by buying the short ETFs PST and TBT, which are the reverse of this chart. Holders of those issues have been burned and perhaps they have made a sacrifice from which we may benefit. Timing is everything.
 Sooner or later some heavy profits will be made shorting bonds. Whether this is the first of them or not remains to be seen.

