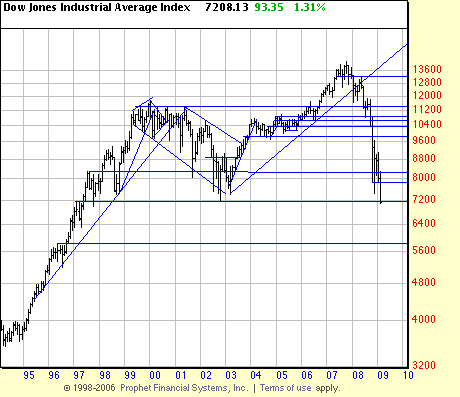
Frankly only an Obama miracle can stop the sky from falling now. Monday’s action was so damaging that it raises the very real prospect that the market could fall to the 5800 level. The previous November low is taken out by sufficient margin that the previous trading range is ended and the broad downtrend reaffirmed. At this point only issues with strong charts should be held. Here is the immediate picture:
 The low from 2002 is marked. While rallies may occur (and should) it appears increasingly likely that further major downside is in store. The long term chart is presented below.
 No experienced technician is required to see the next level of support — around 5800. The line from 2002 might offer some hope — but you know what they say — unsuccessful investors hope when they should fear, and fear when they should hope.


Dear Mr. Bassetti,
In looking at the GLD chart, there are numerous gaps on the way up from the lows back in 2008 – do you think there is a high probability they will be closed before GLD takes off into 1000 + ground?
Hal Goldberg