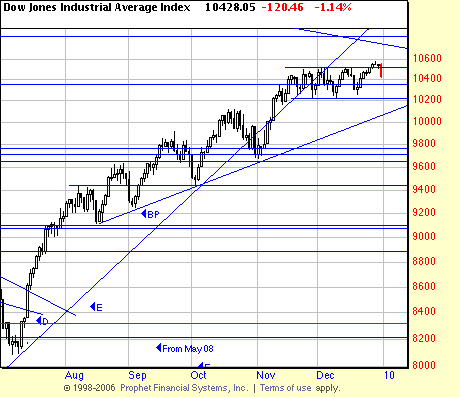
As is obvious the sidewave continues, and as we predicted tight coiling volatility was followed by explosive volatility. Nevertheless today’s long down day, as can be seen has little if any impact on the pattern (although we don’t like the impact it has on the value of our portfolio. We just grin and bear it.). Before the downdraft the Dow had actually managed to make a new high and appeared to be drifting out of the rectangle.
Here is the table which tracks trading days and percentages of this wave:
| Start Date | End Date | Start | End | Points | % | Up | Down | Drift | % up | % down | High |
| Days | Days | flush | to high | ||||||||
| 3/6/09 | 5/8/09 | 6469.95 | 8587.54 | 2117.59 | 32.73% | 45 | 32.73% | ||||
| 5/8/09 | 5/21/09 | 8587.54 | 8221 | -366.54 | -4.27% | 9 | 13 | -4.27% | |||
| 5/21/09 | 6/11/09 | 8221 | 8877.92 | 656.92 | 7.99% | 15 | 7.99% | 3.38% | |||
| 6/11/09 | 7/8/09 | 8877.92 | 8087.18 | -790.74 | -8.91% | 19 | 23 | -8.91% | |||
| 7/8/09 | 8/7/09 | 8087.18 | 9437.71 | 1350.53 | 16.70% | 23 | 16.70% | 6.31% | |||
| 8/7/09 | 8/17/09 | 9437.71 | 9116.59 | -321.12 | -3.40% | 6 | 10 | -3.40% | |||
| 8/17/09 | 8/28/09 | 9116.59 | 9630.2 | 513.61 | 5.63% | 10 | 5.63% | 2.04% | |||
| 8/28/09 | 9/3/09 | 9630.2 | 9252.92 | -377.28 | -3.92% | 5 | 9 | -3.92% | |||
| 9/3/09 | 9/23/09 | 9252.92 | 9917.99 | 665.07 | 7.19% | 14 | 7.19% | 2.99% | |||
| 9/23/09 | 10/2/09 | 9917.99 | 9430.08 | -487.91 | -4.92% | 8 | 11 | -4.92% | |||
| 10/2/09 | 10/19/09 | 9430.08 | 10117.98 | 687.9 | 7.29% | 12 | 7.29% | 2.02% | |||
| 10/19/09 | 11/2/09 | 10117.98 | 9678.95 | -439.03 | -4.34% | 11 | 11 | -4.34% | |||
| 11/2/09 | 11/17/09 | 9678.95 | 10438.16 | 759.21 | 7.84% | 12 | 7.84% | 3.16% | |||
| 11/17/09 | 12/31/09 | 10438.16 | 10263.9 | -174.26 | -1.67% | 31 | -1.67% | ||||
| 11/2/09 | 12/4/09 | 9678.95 | 10526.7 | 847.75 | 8.76% | 24 | 8.76% | 3.98% | |||
| 11/2/09 | 12/29/09 | 9678.95 | 10580.33 | 901.38 | 9.31% | 43 | 9.31% | 4.57% |
The rectangle now is 31 days long. The longer it goes on the more important will be the breakout. The bottom two lines observe the fact that there have been two highs in this rectangle and the high of 11/2. This same data can be seen visually, but sometimes the numberification can emphasize the visual pattern and keep us from wishful visualizing.
As we previously remarked many traders/investors/analysts are hoping/fearing/expecting a downwave here, and the rectangle may be accomplishing the same purpose for them. Good practice dictates that one not anticipate the direction of the breakout from the rectangle. This can smart if it breaks out on the downside, but that’s life in the trendfollowing lane.
Happy New Year to all our valued readers.

