http://stockcharts.com/h-sc/ui?s=$INDU&p=W&yr=4&mn=0&dy=0&id=p14903824659&a=205853690
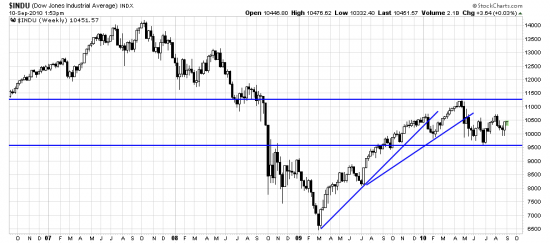
See anything interesting here? Unlike what you see is what you get, what you see is what makes you successful or not. Was it Goethe who said you see what you know? What we know is that these two horizontal lines define the sideways mule market. In the Dow about 1640 points. And about a year in duration.
If you were a technical analyst you would see, and say, ahh, the top line is right where you would expect resistance to be — and the bottom line is right were you would expect support to be.
http://stockcharts.com/h-sc/ui?s=$SPX&p=D&yr=1&mn=0&dy=0&id=p00192805002&a=203402456
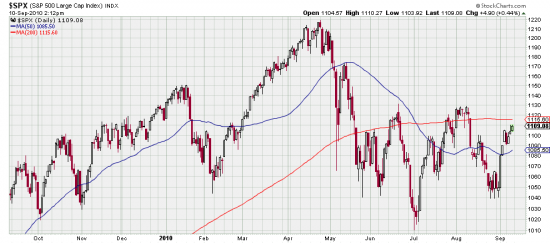
In the S&P about 210 points. The sideways nature of this is emphasized by the year long chart. Incidentally in this chart you can see the problem with moving averages. When price starts whipping back and forth across the average it is the trailing indicator of a sideways market. When you have to look at a yearly chart to get perspective it makes you acutely aware of the sideways character of things. What is going on here?
Major foundation building. And major flushing the market of the undeserving and unworthy. These people must be disposed of before the smart money can kickoff a new campaign to make the unworthy eat their hearts out at having missed the new sure thing train to riches. They are already taking gas in bonds, but the market imperative is that the market must do what is necessary to cause the maximum pain to the majority of participants.
When is the train leaving? Damn. Just mislaid our train schedule. And our crystal ball just clouded over because of smoke from the San Bruno fire and the forest fires in Russia. So what do we know? (if anything)
Well we know that the bond market looks to have topped. We know the stock market is sideways. We know the euro is moderately downtrending. We know the metals just made new highs and are at resistance. (We suspect they will be flushed soon, but that’s not something we know.) We know that Chinese real estate will soon melt down in the Gringo Syndrome (this is where prices melt all the way down through the earth and surface in Kansas, like the American real estate China Syndrome.)
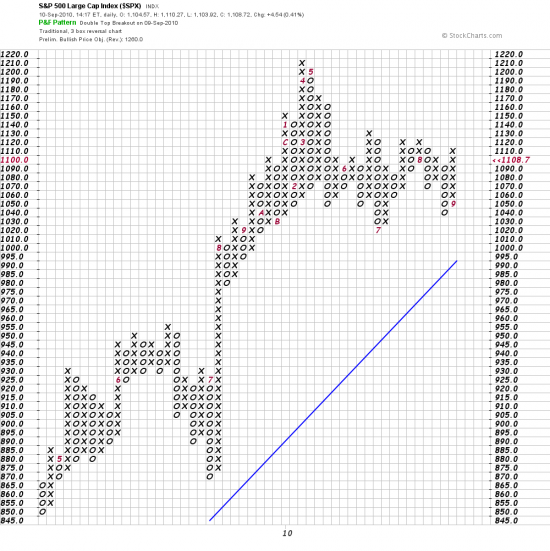
Then there is the point and figure chart, which claims that the market broke out yesterday and is going to 1280 — do we believe it it? tant p n f.
We will shortly look at the little picture. In the meantime a moment of silence for the victims and tragedy of 9/11.
Om mani padme hum.


