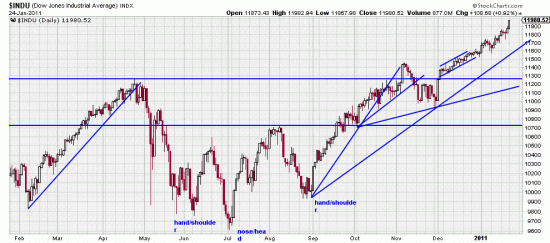
 108 points in the Dow. And power bars all over the place. We will be adding on to our positions shortly. There is absolutely no sign of a downwave or retracement at this point, and that is sort of surprising. But, after all the last wave was 53 days long. Of course that was following by a bit of pain. But the wisdom of gritting teeth and bearing the pain has been amply illustrated. We note with amusement (and have over the last month) the predictors and forecasters who have been shorting and forecasting a wipe out. Ourselves, we would never predict or forecast because that is the way to get egg on your face.
On the other hand here is a PnF chart which targets 14000 on the Dow. Chart from Stockcharts.com, so don’t blame us if it doesn’t work. And REMEMBER PnF charts don’t predict time and also don’t care if there is a plunge on the way to the target.
 Also remember. The purpose of economic forecasting is to make astrology look good. Just take care of the moment, and the long run will take care of itself.
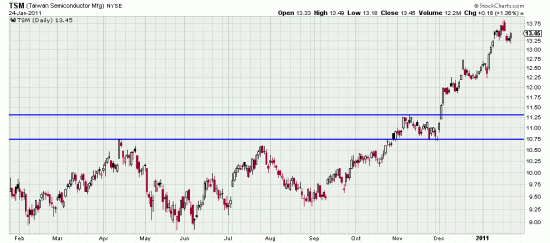
 Our google group analysts have aptly called attention to TSM and IBM which have both built substantial bases and are now running. Much as we dislike handicapping stocks (worse than handicapping horses, even when the jockeys are honest) these look like valid investment vehicles.
 Stockcharts automated PnF routine looks for 21 here. It wouldn’t surprise us if it went on higher.
 The projected price here is 232 and this is a chart of undeniable strength. Regardless, put a 5% stop under today’s low, as you should also do with TSM.

