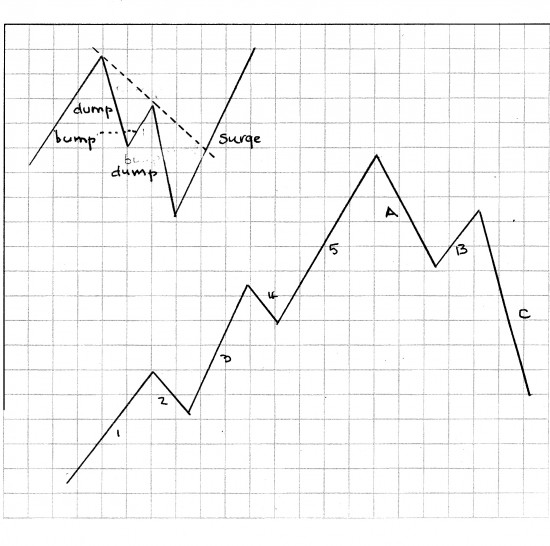
 The first pattern, on the left, derives from observations by ourselves. That is, in an uptrend a downwave, often violent and quick creates a downwave (dump, or sell-off) which is arrested by buyers looking for bargains causing the bump. They are shortly punished for buying a downwave by another dump. The wavelet plays itself out and cannier traders jump on the issue and create a power bar up and a surge (seen as the dotted line is crossed). This pattern often furnishes us with an opportunity to re-enter a trend we exited (for whatever reason). This pattern seems to be fractal and operate on large and small scales. The trade can be signaled by the penetration of the dotted line and/or by the making of a new high. The bottom of the wavelet down furnishes a good Basing Point (but with a tighter filter than a full trend filter). Ironically buying when a new high is made is probably more conservative — although many many investor/traders shy away from buying new highs.
The right diagram is, of course, the classic Elliott Wave Pattern. We are not Elliotticians, although we find the theory interesting. We divide our interests into theoretical and pragmatic and Elliott Wave falls into the theoretical for us. However one part of the pattern we find to be useful –the ABC pattern of downwaves. You could even call our dump,bump,dump pattern an ABC and we wouldn’t be offended or insulted.
Recently we pointed out that real estate looked to us to be in the B wave with another downwave to come. Let us also point out that there may be more than one C Wave.
A SILVER LINING IN THE THEORETICAL CLOUD…..
Last week’s sell off (in just about everything) has not conformed to the dump/b/d pattern but a new high has been made in silver, so we have added on to our position.

