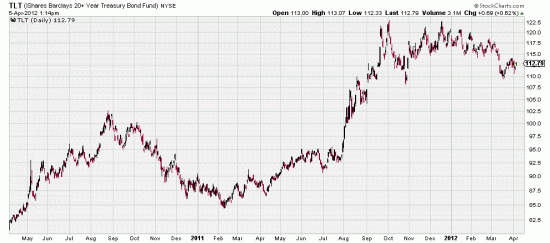
 http://stockcharts.com/h-sc/ui?s=TLT&p=D&yr=2&mn=0&dy=0&id=p88954422605&a=261274354
For fun you can go to the link and print the chart, mark it up, and compare your analysis to ours. (below) You should do this before reading the rest of the letter.
As a break to allow you to do that if you want we insert here the stockcharts.com PnF chart.
 As you can see the PnF analysis expects a plunge in the bonds. No great surprise. Everybody in this universe knows that the bond balloon is due to come to earth. And not one of them, including ourselves, knows the schedule. We thought the downside gap in March might be the beginning, although our economic hat told us that the timing seemed wrong. When there was no downside followthrough and the gap was being closed we closed the trade.
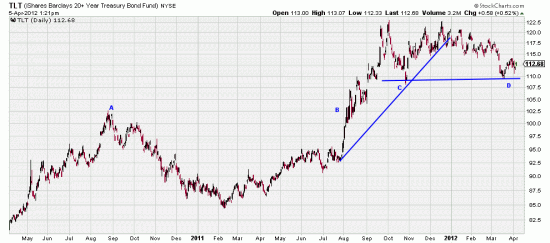
 From November to August (A-B) there is a rounding bottom here, from 103 high to 84.46 low, a formation with 18.54 depth. Adding this to the high, 103, we get a target of 121.54. Funny thing. Market topped at 122.73. From C to, D, Oct to April (m/l) we have a rounding top. High 122.73, low 108.13, depth 14.6, subtracted from the low gives us a target of 93.53.
Do we believe these marvelous (a word you don’t hear too often about chart analyses) analyses? Not very likely, considering the only thing we believe in is the innate and inherent treachery of the market and that the sound of one hand clapping is not silence. (A tip off to where our true orientation lies.)
On the other hand (the one that is not clapping) we will short this market when the horizontal line is broken. You could even short it now, but you would have to stop it at the March high (plus filter).
And remember what Jim Rogers said about catching market tops. “Everybody talks about how Jim Rogers catches market tops. They don’t talk about the seven or eight tries it took me to do that.”

