 http://stockcharts.com/h-sc/ui?s=$SPX&p=D&yr=0&mn=7&dy=0&id=p10149991945&a=259588108
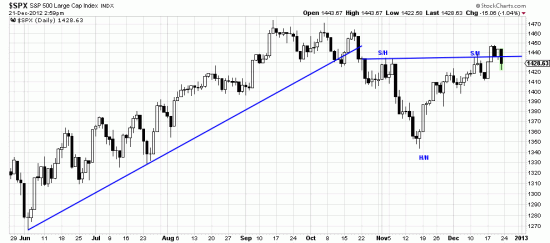
Recently analysts have been talking about a head-and-shoulders pattern in the SPX. We can’t see a H&S but we see a Kilroy, or reverse head-and-shoulders which we have marked here. S/H is shoulder/hand and H/N is head/nose (see the 9th or 10th edition Technical Analysis of Stock Trends). The depth of this formation, 91 points, implies a target of 1525. This may be a chancy interpretation, given that the Kilroy usually occurs at the end of a downtrend, but it fits with our analysis of higher highs. Of course this assumes that the kabuki show in Washington will get all the clowns back into the clown car and then drive off the cliff.

