
http://stockcharts.com/h-sc/ui?s=$INDU&p=W&yr=4&mn=0&dy=0&id=p95004260755&a=268628424
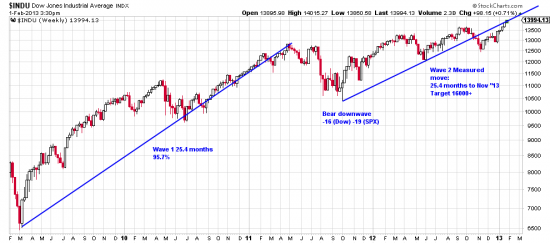
Our esteemed colleague Jack Schannep (thedowtheory.com) has reminded us of an old technical analysis method — that of taking a wave finished by an (effective) bear market, measuring it, and calculating the possible second wave. Since Mar 09 the market made a 25.4 month wave of 95.7%, interrupted by a downwave, and then resumed in a second wave. If we accept the posit that the second wave can be predicted based on the first wave we are presented with a target of 16000+ in November of 2013.
Now, all together, in unison, –do we believe this….? Readers know our answer to this question.
However, very interesting, what does the PnF chart have to say on the subject?
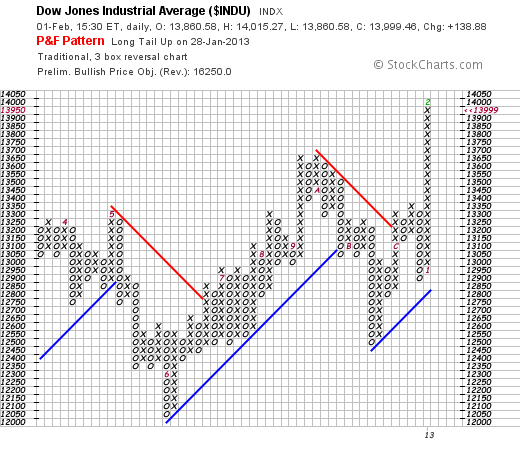 Based on the present pattern the PnF chart looks for a target of 16250. Now what is the other constant refrain? You don’t have to believe this — all you have to do is SEE what the chart is saying at THIS MOMENT.