
http://stockcharts.com/h-sc/ui?s=$SPX&p=D&yr=0&mn=8&dy=0&id=p57309614995&a=266398464
Analysts know that — in general — five days down is a buy on the close of the fifth day down. Ever slow of foot we got some of it and missed some of it clumsily moving money around amongst accounts. Friday’s explosion should put paid to the sell off, which doesn’t even qualify as a wave — and maybe not even as a wavelet. It might quiet anxiety as to fears of a severe correction — or downwave.
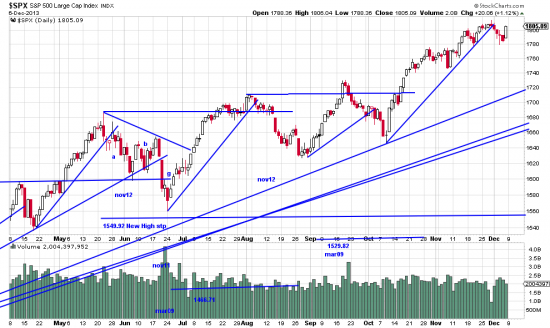
But we now have a 42 day wave so the risk of a correction remains high. It is a sign of market strength that it responds to the five days with a day like Friday. Talking heads on the other hand see it as signs of irrational exuberance. They have forgotten what real irrational exuberance looks like (cf. real estate circa 2007). In this case this wave is 301 points for an advance of — hold your breath — 2 percent. That’s an average of 7 points a day. If this draws shorts into our sausage machine, welcome to them.
Gloom and doomers have an attractive product to sell: FEAR. The antidote is to analyze the chart. And the chart says: bull (if not bull sh*t) market.
We are short gold and silver and bonds. Long IWM and Qs and of course the SPX (UPRO) in which we have obscene profits.
We increased our SPX position after being hedged for the down wavelet (closed).