
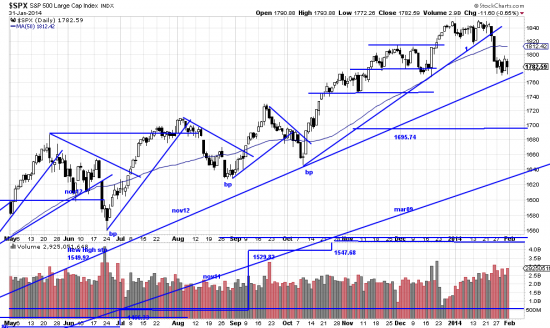
Recently we referenced the PnF chart for the S&P which advertised a high price objective for the index. We noted that the chart pattern also included a “long pole (or high pole) warning”. A long pole warning is a pattern which occurs in PnF charts which warns of near term weakness. Briefly, in the chart a series of higher prices causes a string of advancing Xs. This advance is revealed as an overbought move when the column is followed immediately by a series of Os which takes back the price advance. The reader can easily relate this chart pattern to recent events in the market — prices advance to 1800 stall there (which, note, causes no entries on the chart) and then fall out of bed over the last several days. And indeed this high pole warning is now borne out by the breaking of the short term trendline and the threatening of the long term trendline from Nov ’12.
Here is the PnF chart followed by the candlestick chart.
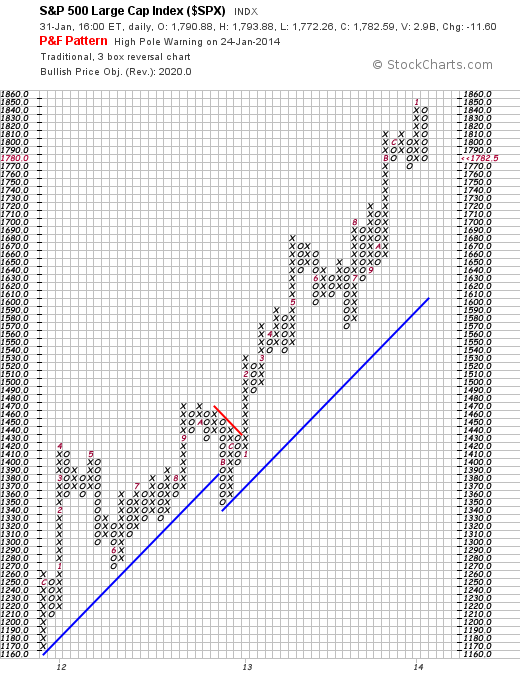
The last two columns on the chart depict the warning. The payoff of this chart is actually in the header. The algorithmic software analysis of the chart looks for a price objective of 2020. 2020!? Does that seem reasonable?
Well, if it’s not, don’t blame us. In Barrons Jan 27 Abby Joseph Cohen, the Goldman maven, says Goldman research looks for 1900 in 2014, and if P/E ratios expand the index could rise to 2088. For the thousandth time, we don’t predict. We just look at the chart and analyze what to do right now.
http://stockcharts.com/h-sc/ui?s=$SPX&p=D&yr=0&mn=9&dy=0&id=p83750808625&a=214966864
Here, although the short term line is broken and the nov12 trendline is threatened prices have held this week at the first line of support. And of course, this week we have had the (undesired) entertainment of bungee markets — up, down and vice versa.
While this week has been trying let us put it in long term perspective. Look at how far away the trendlines and stop lines are. Immediate turbulence and long term reward are staring out of this chart. Equity volatility is never fun, but long term trend followers win the biggest in the long term. And they do it because they are not shaken out of the market by every short term pole cat.