
As is clear to everyone now the market has hit a roadblock. Whether this is a consolidation roadblock or a reversal roadblock is not known at this time. Over the next several letters we will examine the facts and see what action conclusions may be drawn from them. First, the INDU has essentially been in a sidewave since December 1 when it closed at 16008. A few days ago the low was 16028. You could make a case that the pattern might be a double top.
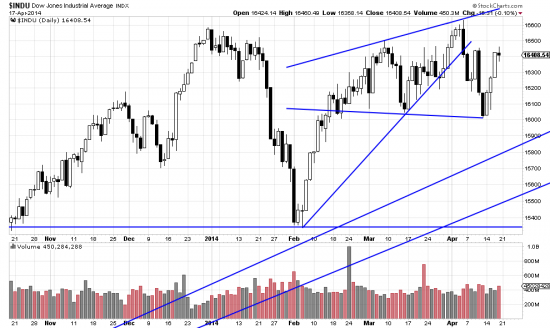
http://stockcharts.com/h-sc/ui?s=$INDU&p=D&yr=0&mn=6&dy=0&id=p61670847249&a=214738592
In addition, as shown above, there is a moderate broadening pattern, not to mention the very short term trendline that is broken. None of this is positive. In fact it is all negative. Broadening patterns occur most often to reverse the major trend and are typical of major contests between buyers and sellers. The 99-00 market top was marked by a huge broadening top which made us switch to a trading strategy at the time. (Illustrated in the 10th edition.) This is obviously a minor example, but must be noted as part of the evidence.
The evidence also includes a broadening formation in the SPX.
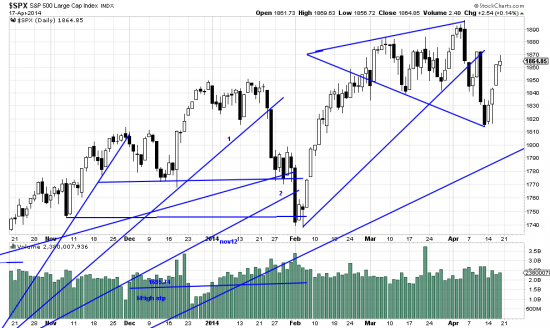
http://stockcharts.com/h-sc/ui?s=$SPX&p=D&yr=0&mn=6&dy=0&id=p83257770514&a=266398464
The SPX closed at 1848 on December 31. A few days ago the low was 1815. These are facts which portray a sideways market. Now let us belabor the obvious with an observation which will undoubtedly be quoted in investment literature for many years to come: When new highs are not made within a reasonable time frame it may be assumed that a top has been achieved. But let us not jump to conclusions, as Evel Knievel said. The blockage of advance does not always mean a reversal. It can also mean a consolidation. But–AND– It is worth noting that the PnF method is looking for a downwave of modest proportions in the major indices. (To be published shortly.)
Part of the reason for the blockaded indices is the collapse of the biotechs and the internet issues. Informed opinion reports that CTAs and hedge funds started playing musical chairs in COMPQ in March — and the chart shows it. This was purely a contrarian musical chairs play. Those managers are all under pressure because of mediocre performance over the recent term so they didn’t sit on good profits in March. The results were sharp pullbacks in biotech and the internet and consequently in the NASDAQ. Those people are now sitting on cash, which is an uncomfortable cushion when you have to justify your compensation package to clients.
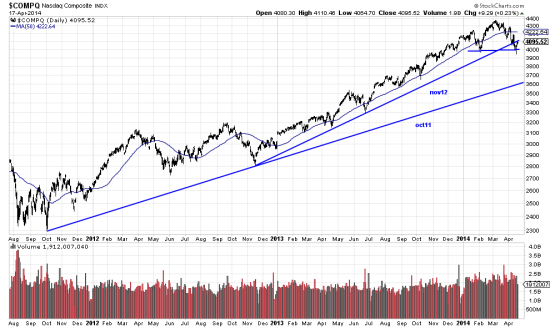
http://stockcharts.com/h-sc/ui?s=$COMPQ&p=D&yr=2&mn=9&dy=0&id=p65458040894&a=325314459
Adding negative facts to the analysis, COMPQ has broken the trendline from nov12. This is a very negative sign. If the break is confirmed serious damage will result. The rounding over formation does not help even though it hardly qualifies as a rounding top, which should be longer in time and less volatile in the bar structure.
Withal, not a bunch of pretty pictures, and certainly not one for putting more money on the table. Quite the opposite. Time to conserve cash, adopt defensive positions and even lower the risk profile, and even be prepared to hedge.
How’s that for an Easter Egg in your stocking?