
We may be a bit ahead of the curve here, but the chart for the Russell 2000 looks a lot like the chart patterns which appeared in 2007-08. And the trade signal has not yet appeared but short is the way to bet. Always trying to steal a march or jump the gun (or jump the shark) we will short this next week and use a money management stop. Smarter and more conservative investors will wait for the horizontal support line to be clearly taken out. Sometimes we wish we had not been born schizophrenic, but most of the time we just enjoy it.
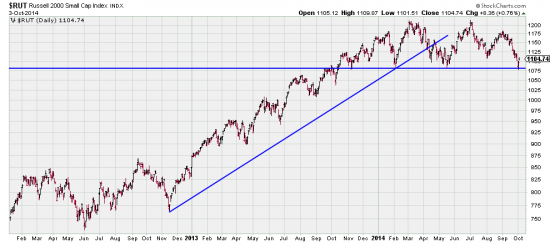
Here is a classic top chart:
http://stockcharts.com/h-sc/ui?s=$RUT&p=D&yr=5&mn=9&dy=0&id=p28797405528&a=237012379
Here we are breaking the nov12 trendline.
http://stockcharts.com/h-sc/ui?s=$RUT&p=D&yr=5&mn=9&dy=0&id=p28797405528&a=237012379
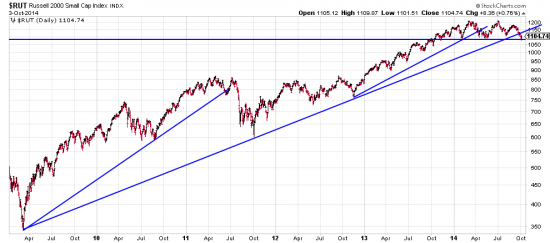
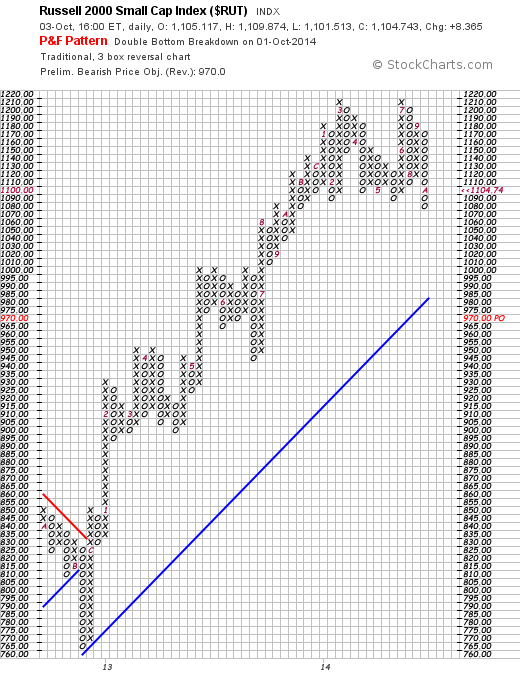
Here, even more ominously we are breaking the mar09 trendline, a heavy warning, but subject to confirmation. At the moment this looks like a forgone conculsion to us, but like Niels Bohr we are often wrong about the future. In the first chart note that we might interpret the formation as a massive two headed head and shoulders. The PnF system concurs looking for a drop to 970. As the market always overshoots, in a bear market the payoff could be larger. One positive for this trade is it potentially hedges long bets in the SPX as well as being a valid trade on its own. TZA is a 3x bear bet, RWM a 1x.
(no link. Check it out at Stockcharts.com.)
We will scale in to this as price erodes. A stop of 5% would be appropriate. Some care must be exercised so as not to short into the surge in process off the lows of the just finished (?) dowwave.