
http://stockcharts.com/h-sc/ui?s=%24SPX&p=D&yr=1&mn=0&dy=0&id=p96995943835&a=413887823
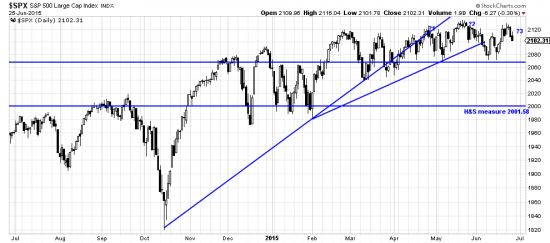
It is a characteristic of prices at tops to do two things: drift sideways and break short term trendlines. Here a trendline from feb15 and a longer and more significant trendline from oct14 are broken.
Here we begin to see some shape to the market. And it is not pretty. Without too much contortion we can see a possible head and shoulders.
http://stockcharts.com/h-sc/ui?s=%24SPX&p=D&yr=0&mn=3&dy=0&id=p76611673066&a=266398464
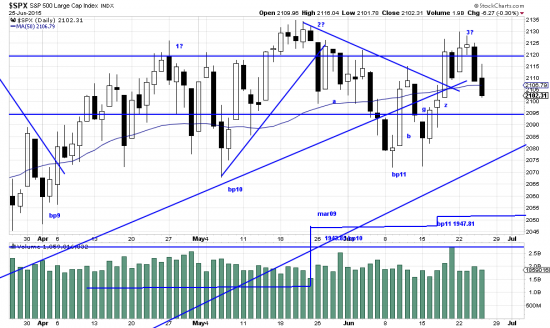
Here the shoulders (or possible shoulders) are marked 1? and 3?. 2? would be the head. There is quite a lot of symmetry in this pattern, from the downwaves establishing the neckline to the highs marking the shoulders to the inner waves between shoulders and head. Analysis has been damned difficult during this period and this stealth pattern is one of the products of the difficulties. Well, how confident do we feel of this interpretation? Mezzo-mezzo as Slyvio Burlusconi says. We feel confident enough not to be buying anything. Not enough to be short yet, but confident enough to be hedged. Several weeks ago we spoke of hedging for readers and we are always slow to do that. It would have been a good idea evidently.
Now — it is not a H&S until it penetrates the neckline and is confirmed.
http://stockcharts.com/h-sc/ui?s=%24SPX&p=D&yr=0&mn=5&dy=0&id=p35555977307&a=413887823
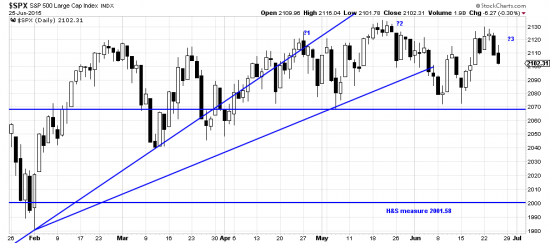
The neckline is illustrated here, and so too is the measurable extent of a downwave resulting from the formation–2001.58. Remember — this is a tentative analysis. Only time will tell how accurate it is. Our personal accounts as we previously said went to the sidelines to prepare for option and futures trading. But our family accounts are still in as determined by the Magee Basing Point Procedure.
Readers should do some deep thinking as to what they would do if this prognosis is realized. They might want to re-read our letter on hedging. We never promote a view of the market. The chart rules. By the same token the fastest and best profits are made on the bear side.