
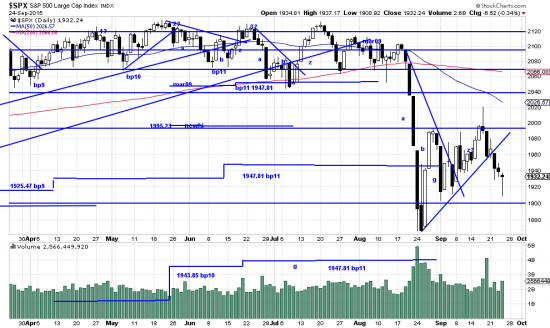
http://stockcharts.com/h-sc/ui?s=%24SPX&p=D&yr=0&mn=6&dy=0&id=p38955316076&a=266398464
It seems to us that the SPX (and thus the market) is headed for a retest of the September low. There may be a day or so of upside, but the market will hang fire until the low is tested. So we are going to hedge our positions and wait to see what the market does to cause pain and consternation here.
Meantime, some common sense in the INDU:
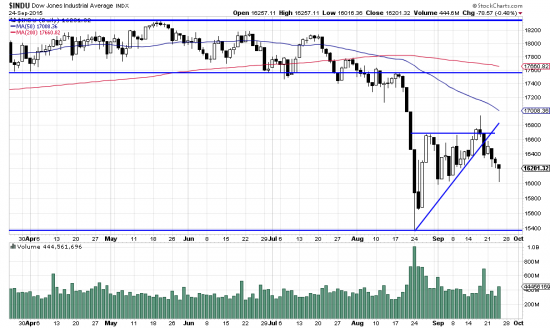
http://stockcharts.com/h-sc/ui?s=%24INDU&p=D&yr=0&mn=6&dy=0&id=p31650012639&a=424811737
Trading, investing or just fooling around between the top and bottom horizontal lines is just cruising for a bruising. Price has broken out of the triangle and appears headed down. Our all too human nature wants to buy the bottom and score an ego win. Good luck with that. Get your ego kicks from fantasy football.
The transient nature of what is happening here is notable from the fact that: Only in the last few days has the August 24 sell off low been confirmed as a wave low by the three-days-away method. The second important downwave of September 1 has not yet been confirmed as a wave low by the method.
Time to let the naked mud wrestlers do their thing.