
http://stockcharts.com/h-sc/ui?s=%24SPX&p=D&yr=0&mn=6&dy=0&id=p38955316076&a=266398464
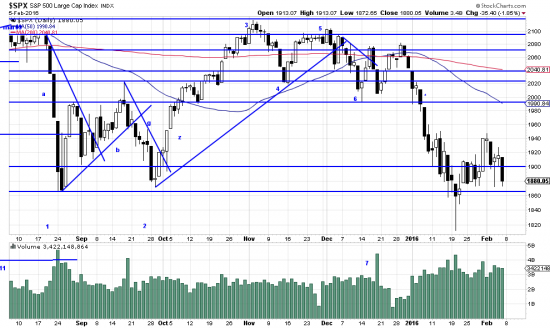
What might have been a b wave now looks likely to be a bottom formation (at best). (Note volume formation.) And a bottom formation subject to the whims of contrarians and short term traders. This situation will probably continue until it ends.
In conditions such as these traders and investors get into trouble out of boredom. To help counteract this we offer the following comments:
http://stockcharts.com/freecharts/pnf.php?c=GLD,PWTADANRBO[PA][D][F1!3!!!2!20]
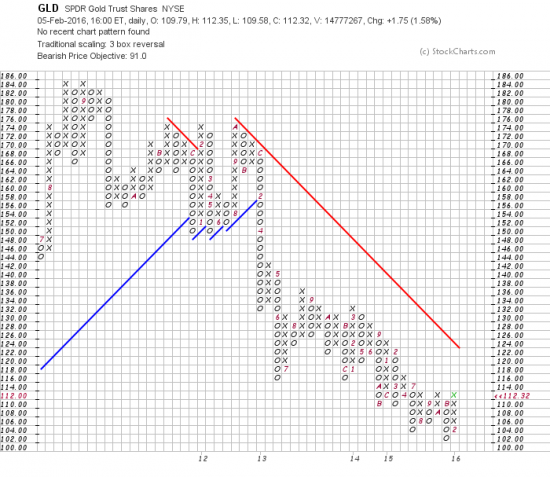
This nasty looking chart targets a GLD price of 91, but there are some subtlties the PnF hasn’t seen.
http://stockcharts.com/h-sc/ui?s=GLD&p=D&yr=1&mn=0&dy=0&id=p07859751408&a=444325833
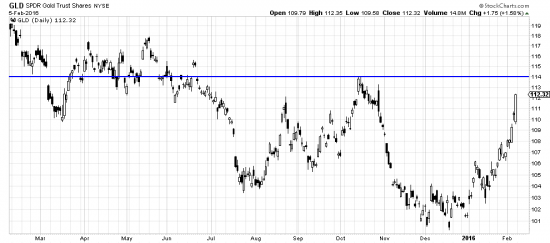
Quite apart from the strength of the present wave there is a rounding bottom here which may have some importance. While not a major rounding bottom it has the same implications of any such formation: in this case the depth of the formation –or, 14 points for a target of 128 more or less.
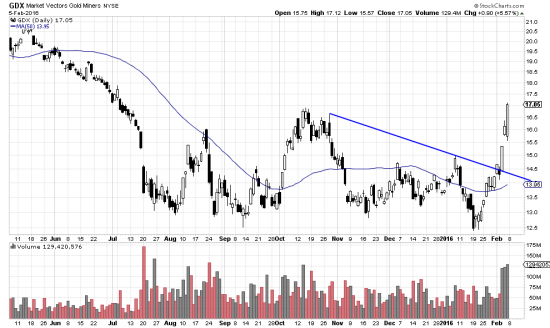
Along with the surge in GLD the gold miners have perked up:
http://stockcharts.com/h-sc/ui?s=GLD&p=D&yr=1&mn=0&dy=0&id=p07859751408&a=444325833
http://stockcharts.com/h-sc/ui?s=GLD&p=D&yr=1&mn=0&dy=0&id=p07859751408&a=444325833
http://stockcharts.com/h-sc/ui?s=GLD&p=D&yr=1&mn=0&dy=0&id=p07859751408&a=444325833