
http://stockcharts.com/h-sc/ui?s=%24INDU&p=D&yr=1&mn=0&dy=0&id=p68692925235
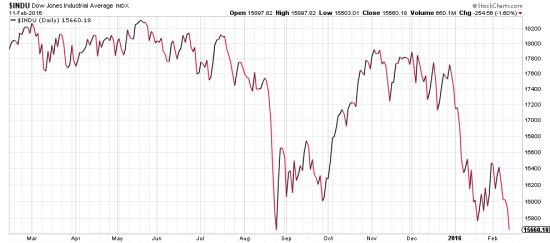
We have, after much agonized analyzing, come to the conclusion that we are in the midst of a market storm which is a force of nature, and there is no understanding of it. So instead of beating our heads against the wall of obscurity we must fall back to complete simplicity — what does the chart say?
http://stockcharts.com/h-sc/ui?s=%24SPX&p=D&yr=0&mn=6&dy=0&id=p38955316076&a=266398464
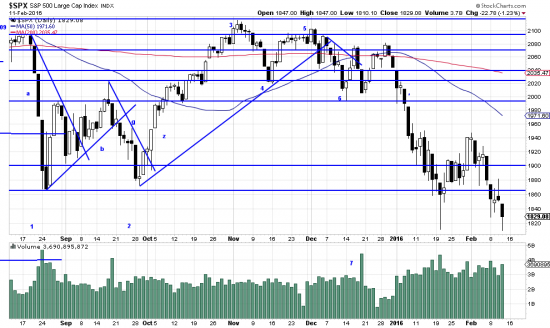
What the chart says is that we are in a more or less percipitous downwave which we don’t understand. We are beginning to get some idea — It appears unlikely that this period will conclude until the oil market bottoms. The INDU has (as even MarketWatch has noted) made a new low, and fulfilled the technical definition of a downtrend — lower highs and lower lows. This has already occurred with the SPX. We should comment that conventional definitions of bear markets mean nothing to us. Right now the Dow is off about 14% which looks painful enough to us without hanging a bear market label (20% down) on it.
As we have nagged for months being long here is material for masochism.
The question now is when we buy. Price earnings ratios have been put in order by the market itself, quieting the value birds. At last. We will address the buying question in the immediate future.
5