
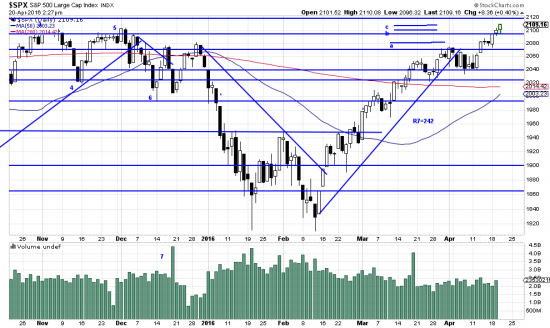
While we were wrapped hand and foot negotiating a really bad transaction with the Internal Revenue Service prices snuck out to the upside, making new highs. New Highs are always inflexion points and represent a battle zone for contrarians and investors. We bought more.
http://stockcharts.com/h-sc/ui?s=%24SPX&p=D&yr=0&mn=6&dy=0&id=p38955316076&a=266398464
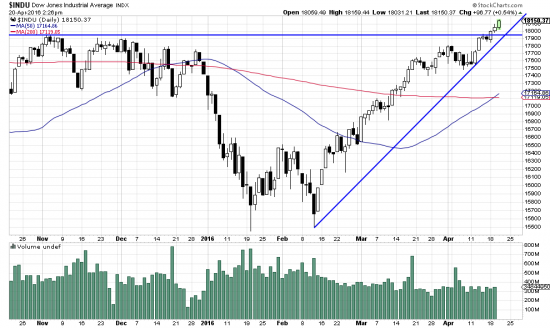
All the signs of a trend are here. The broken trendline gives prices an excuse to sell-off, but instead of a selll-off we get a short consolidation. Then we begin taking out old highs. This is seen better in the INDU chart:
http://stockcharts.com/h-sc/ui?s=%24INDU&p=D&yr=0&mn=6&dy=0&id=p63918072833&a=455340955
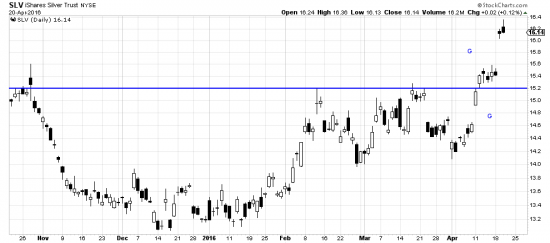
The breakout is shown better here. We will want to see confirmation, but we already started buying. In general there are many positive charts and strong issues, and the advance seems quite broad based. Among these strong issues is silver which just popped — and that after showing a breakaway gap. The original gap was anomalous — it might have been a common gap. But subsequent behavior clearly identifies it as a breakaway, followed by a runaway gap. We have previously remarked on the rounding botom here which lends much strength to the chart.
http://stockcharts.com/h-sc/ui?s=SLV&p=D&yr=0&mn=6&dy=0&id=p94735009296&a=455395444
Once again, we don’t think this is a major trend, but the chart will tell us. In the meanwhile we treat it like a trend with this showing.