
http://stockcharts.com/freecharts/pnf.php?c=%24SPX,PWTADANRRO[PA][D][F1!3!!!2!20]
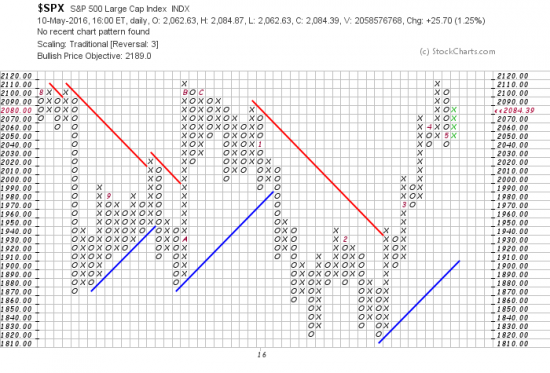
The PnF method is looking for a target of 2189 in the S&P. This method has served us well as we have recently documented. Nonetheless at this time there is more than usual uncertainty in the air as the market has drifted sideways into the doldrums for 30 days. One might think that the explosion in the market today is a breakout signal but we see it as a tantalizing temptation and are inclined to wait for the recent highs to be taken out. Or, stick a toe in the water and see if it gets eaten off by the HFT piranhas. If it doesn’t, stick the whole foot in, but be aware that they might saw the limb off behind you. (Creative mixed metaphors manufactured here on demand.)
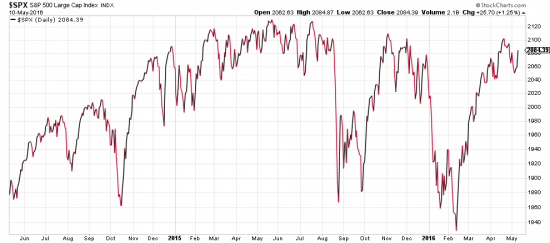
There is definitely a volcano shaking under the surface here, and its implications are large, so we think readers should look carefully to their portfolios and to defense until whatever is going to happen happens. The volcano is illustrated below.
http://stockcharts.com/h-sc/ui?s=%24SPX&p=D&yr=2&mn=0&dy=0&id=p46281875213
21 months of energy have built up in this market with several warning eruptions in September and February. Given the right (or wrong) conditions this thing might make Etna look like a science toy. The PnF method thinks the energy will be vented upwards. Perhaps. And perhaps wise and prudent investors minimize their exposure or hedge and reduce their risk.