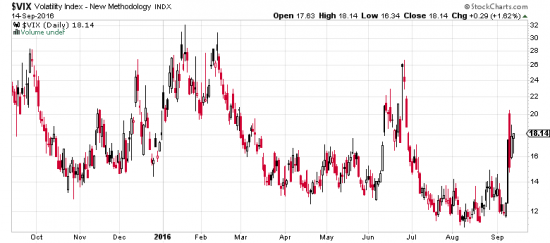
VIX attempts to measure the expected 30 day volatility of the SPX by averaging the weighted prices of SPX puts and calls over a wide range of strike prices. Financial journalists always on the lookout to add drama to the boring world of FASB and billion dollar mergers have called the index “the fear index”. There is in fact a negative correlation between the index and SPX prices. You might think of it this way: always hyper sensitive traders hear the market say boo and they spook like John Wayne’s cattle herd and run for cover. Their cover is puts. This immediately drives up the prices of puts and the implied volatilities of those puts. The VIX is a measurement of these market mechanics. When the panic passes volatility reverts to the mean.
In the chart you can see this process playing itself out:
http://stockcharts.com/h-sc/ui?s=%24VIX&p=D&yr=0&mn=6&dy=0&id=p52320165888
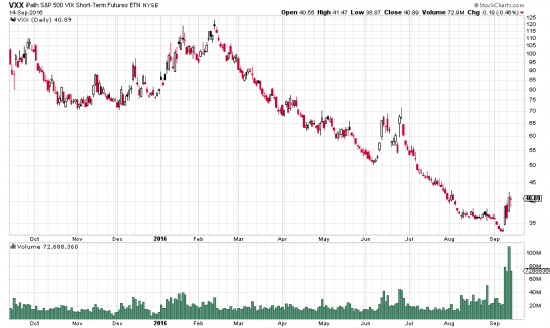
On Tuesday more shares of the VXX (effectively an ETF for the VIX) were traded than any S&P 500 issue — over 100 million shares.
http://stockcharts.com/h-sc/ui?s=VXX&p=D&yr=1&mn=0&dy=0&id=p41003863247
This kind of explosiveness should see some follow through. Of course the immediate bug-a-boo of a Fed rate rise has probably disappeared for September (they’ll take it back out of the closet for December).
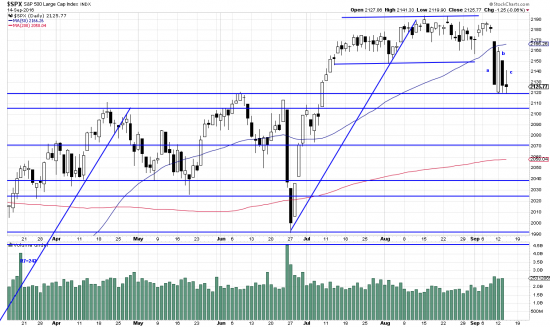
The effect of all this stampeding is seen in the SPX:
http://stockcharts.com/h-sc/ui?s=%24SPX&p=D&yr=0&mn=6&dy=0&id=p70142979615&a=266398464
Prices are exactly at support. But with this kind of volatility in the VIX (which may be ameliorated by Janet and her gang’s not bumping rates) you never know). We have marked prices with a-b-c on the off chance that we have an alpha beta wave here, but we’re not ready to bet on it, or draw in the trend lines. So buying here is strictly a speculation.


