
http://stockcharts.com/h-sc/ui?s=%24SPX&p=D&yr=1&mn=0&dy=0&id=p10599378927
In this bizarre political season, in this surrealistic country, the market frequently gets kooky or kinky (maybe not kinky–that’s the province of the great orange one). (In the investment community the posssibility of a triumph by the great orange one is regarded with fear and loathing — instant lossses of 10 to 15%. We fundamentally agree with this forecast. At the very least radical volatility should result. We’ll discuss this down page.)
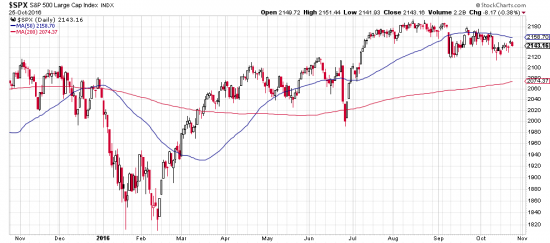
The extremely tight trading range from July is one symptom of the dystopian situation as is the state of the market the last 30 days or so. During this time, as numerous pundits and amateur technical analysts have remarked, price has churned beneath the 50 day moving average, but has remained above the 200 day moving average (Chart above). What does this mean? Well, not very much.
The investment community, in general, regards these two moving averages as important trend indicators and sometimes even makes investment decisions based on their penetration. As our readers know we use much more sophisticated tools. In this case the phenomenon reflects the hung up nature of the market at present. Quite possibly the election will break this log jam. Whatever, the risk will be extreme. You can deal with it with options –and even those are subject to great volatility risk. Consult with an options specialist if considering getting close to this improvised explosive device.