
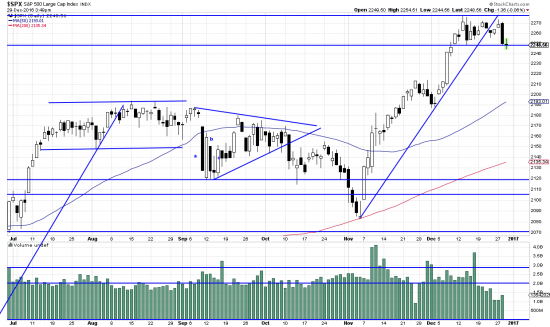
http://stockcharts.com/h-sc/ui?s=%24SPX&p=D&yr=0&mn=6&dy=0&id=p70142979615&a=266398464
Evaluating the volume here it is clear something is up–probably accumulation. Nonetheless the wave which started Nov7 is now consolidating (or, less likely, reversing). The trendline is well broken and today we saw the full effect of that. The trendline is running through a rectangle as defined by the two horizontal lines. This shouldn’t be a big deal — possible implications are about 30 points, and there is support at the 2210-2190 zone. We are not bothering to hedge, and we are not doing any buying until the rectangle is throughly overcome.
We are looking for our crystal ball so we can make oracular and authoritative comments about the coming year. It appears to have got out of the office and followed the cats into the garden. Well, better that than having them lie on the computers. Stay tuned for Ouija board or crystal ball forecast.